- Japan
- /
- Auto Components
- /
- TSE:7283
Aisan Industry's (TSE:7283) five-year earnings growth trails the 34% YoY shareholder returns


The worst result, after buying shares in a company (assuming no leverage), would be if you lose all the money you put in. But when you pick a company that is really flourishing, you can make more than 100%. For instance, the price of Aisan Industry Co., Ltd. (TSE:7283) stock is up an impressive 254% over the last five years. Also pleasing for shareholders was the 15% gain in the last three months.
Since the stock has added JP¥10.0b to its market cap in the past week alone, let's see if underlying performance has been driving long-term returns.
To quote Buffett, 'Ships will sail around the world but the Flat Earth Society will flourish. There will continue to be wide discrepancies between price and value in the marketplace...' One flawed but reasonable way to assess how sentiment around a company has changed is to compare the earnings per share (EPS) with the share price.
Over half a decade, Aisan Industry managed to grow its earnings per share at 32% a year. So the EPS growth rate is rather close to the annualized share price gain of 29% per year. That suggests that the market sentiment around the company hasn't changed much over that time. Rather, the share price has approximately tracked EPS growth.
You can see below how EPS has changed over time (discover the exact values by clicking on the image).
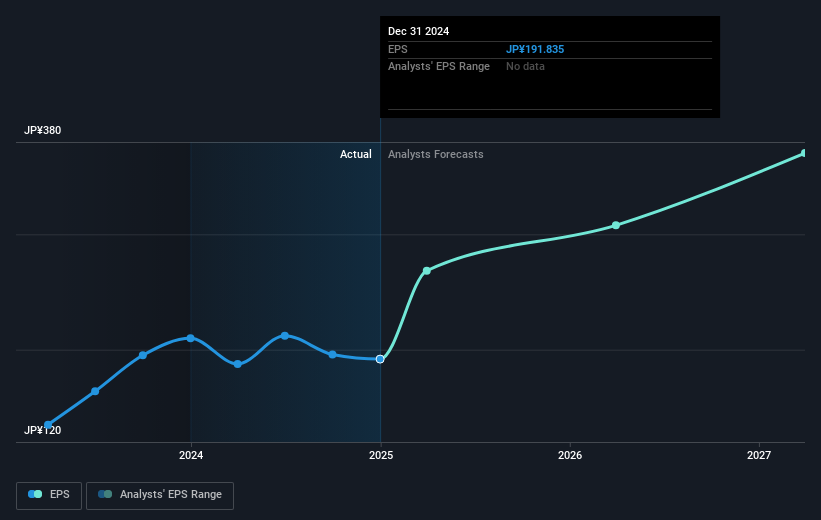
Dive deeper into Aisan Industry's key metrics by checking this interactive graph of Aisan Industry's earnings, revenue and cash flow.
What About Dividends?
As well as measuring the share price return, investors should also consider the total shareholder return (TSR). The TSR incorporates the value of any spin-offs or discounted capital raisings, along with any dividends, based on the assumption that the dividends are reinvested. It's fair to say that the TSR gives a more complete picture for stocks that pay a dividend. We note that for Aisan Industry the TSR over the last 5 years was 326%, which is better than the share price return mentioned above. And there's no prize for guessing that the dividend payments largely explain the divergence!
A Different Perspective
We're pleased to report that Aisan Industry shareholders have received a total shareholder return of 25% over one year. Of course, that includes the dividend. Having said that, the five-year TSR of 34% a year, is even better. It's always interesting to track share price performance over the longer term. But to understand Aisan Industry better, we need to consider many other factors. Case in point: We've spotted 1 warning sign for Aisan Industry you should be aware of.
If you would prefer to check out another company -- one with potentially superior financials -- then do not miss this free list of companies that have proven they can grow earnings.
Please note, the market returns quoted in this article reflect the market weighted average returns of stocks that currently trade on Japanese exchanges.
New: Manage All Your Stock Portfolios in One Place
We've created the ultimate portfolio companion for stock investors, and it's free.
• Connect an unlimited number of Portfolios and see your total in one currency
• Be alerted to new Warning Signs or Risks via email or mobile
• Track the Fair Value of your stocks
Have feedback on this article? Concerned about the content? Get in touch with us directly. Alternatively, email editorial-team (at) simplywallst.com.
This article by Simply Wall St is general in nature. We provide commentary based on historical data and analyst forecasts only using an unbiased methodology and our articles are not intended to be financial advice. It does not constitute a recommendation to buy or sell any stock, and does not take account of your objectives, or your financial situation. We aim to bring you long-term focused analysis driven by fundamental data. Note that our analysis may not factor in the latest price-sensitive company announcements or qualitative material. Simply Wall St has no position in any stocks mentioned.
About TSE:7283
Aisan Industry
Engages in the manufacture and sale of automotive parts in Japan and internationally.
Flawless balance sheet, good value and pays a dividend.
Similar Companies
Market Insights

Community Narratives

