

David Iben put it well when he said, 'Volatility is not a risk we care about. What we care about is avoiding the permanent loss of capital.' So it seems the smart money knows that debt - which is usually involved in bankruptcies - is a very important factor, when you assess how risky a company is. We can see that Suzuki Motor Corporation (TSE:7269) does use debt in its business. But the more important question is: how much risk is that debt creating?
What Risk Does Debt Bring?
Generally speaking, debt only becomes a real problem when a company can't easily pay it off, either by raising capital or with its own cash flow. Part and parcel of capitalism is the process of 'creative destruction' where failed businesses are mercilessly liquidated by their bankers. However, a more usual (but still expensive) situation is where a company must dilute shareholders at a cheap share price simply to get debt under control. Of course, plenty of companies use debt to fund growth, without any negative consequences. The first thing to do when considering how much debt a business uses is to look at its cash and debt together.
View our latest analysis for Suzuki Motor
What Is Suzuki Motor's Net Debt?
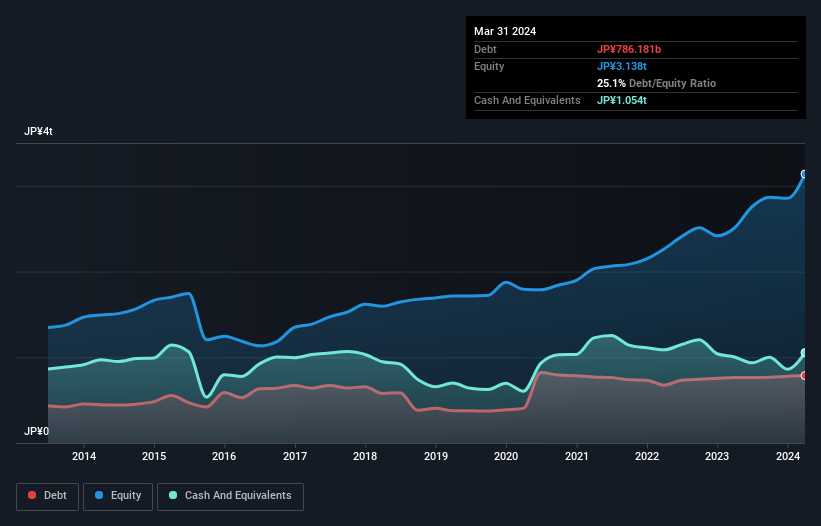
The chart below, which you can click on for greater detail, shows that Suzuki Motor had JP¥786.2b in debt in March 2024; about the same as the year before. However, it does have JP¥1.05t in cash offsetting this, leading to net cash of JP¥268.3b.
How Healthy Is Suzuki Motor's Balance Sheet?
Zooming in on the latest balance sheet data, we can see that Suzuki Motor had liabilities of JP¥1.74t due within 12 months and liabilities of JP¥506.2b due beyond that. Offsetting this, it had JP¥1.05t in cash and JP¥558.8b in receivables that were due within 12 months. So it has liabilities totalling JP¥634.0b more than its cash and near-term receivables, combined.
Since publicly traded Suzuki Motor shares are worth a very impressive total of JP¥3.59t, it seems unlikely that this level of liabilities would be a major threat. But there are sufficient liabilities that we would certainly recommend shareholders continue to monitor the balance sheet, going forward. Despite its noteworthy liabilities, Suzuki Motor boasts net cash, so it's fair to say it does not have a heavy debt load!
On top of that, Suzuki Motor grew its EBIT by 33% over the last twelve months, and that growth will make it easier to handle its debt. The balance sheet is clearly the area to focus on when you are analysing debt. But it is future earnings, more than anything, that will determine Suzuki Motor's ability to maintain a healthy balance sheet going forward. So if you want to see what the professionals think, you might find this free report on analyst profit forecasts to be interesting.
Finally, a business needs free cash flow to pay off debt; accounting profits just don't cut it. While Suzuki Motor has net cash on its balance sheet, it's still worth taking a look at its ability to convert earnings before interest and tax (EBIT) to free cash flow, to help us understand how quickly it is building (or eroding) that cash balance. Over the last three years, Suzuki Motor reported free cash flow worth 20% of its EBIT, which is really quite low. For us, cash conversion that low sparks a little paranoia about is ability to extinguish debt.
Summing Up
While Suzuki Motor does have more liabilities than liquid assets, it also has net cash of JP¥268.3b. And we liked the look of last year's 33% year-on-year EBIT growth. So we are not troubled with Suzuki Motor's debt use. Over time, share prices tend to follow earnings per share, so if you're interested in Suzuki Motor, you may well want to click here to check an interactive graph of its earnings per share history.
Of course, if you're the type of investor who prefers buying stocks without the burden of debt, then don't hesitate to discover our exclusive list of net cash growth stocks, today.
New: Manage All Your Stock Portfolios in One Place
We've created the ultimate portfolio companion for stock investors, and it's free.
• Connect an unlimited number of Portfolios and see your total in one currency
• Be alerted to new Warning Signs or Risks via email or mobile
• Track the Fair Value of your stocks
Have feedback on this article? Concerned about the content? Get in touch with us directly. Alternatively, email editorial-team (at) simplywallst.com.
This article by Simply Wall St is general in nature. We provide commentary based on historical data and analyst forecasts only using an unbiased methodology and our articles are not intended to be financial advice. It does not constitute a recommendation to buy or sell any stock, and does not take account of your objectives, or your financial situation. We aim to bring you long-term focused analysis driven by fundamental data. Note that our analysis may not factor in the latest price-sensitive company announcements or qualitative material. Simply Wall St has no position in any stocks mentioned.
About TSE:7269
Suzuki Motor
Engages in the manufacture and marketing of automobiles, motorcycles, and marine products in Japan and internationally.
Flawless balance sheet with solid track record and pays a dividend.
Similar Companies
Market Insights

Community Narratives


