Advertisement
Is Now the Moment to Reassess Honda Stock After Its Latest 6.6% Pullback?

Simply Wall St
Reviewed by Bailey Pemberton
If you have been watching Honda Motor lately, you are probably wondering whether now is the moment to make your move. The stock’s chart has certainly been busy. After surging 2.1% in just the last week, it is only a small dip away from where it started the year, and when you zoom out, the longer-term story is even more compelling, with an impressive 125.0% gain over the past five years. Despite some bumps over the last month, when Honda ticked down 6.6%, the bigger trend has been upward. These swings spark the big question: is the market fairly valuing Honda, or are there still untapped opportunities?
That is where valuation analysis comes in. By comparing Honda’s numbers across a wide range of checks, from earnings multiples to assets and cash flows, you can start to see where the market might be missing something. Right now, Honda scores a 2 out of 6 on our undervaluation scale, meaning it is undervalued by a couple of key measures, but maybe not across the board.
Let’s break down those methods and look at where Honda stands against different benchmarks. Before we wrap up, I will also show you the most insightful way to weigh valuation, the approach even pros rely on when the usual scores do not tell the full story.
Honda Motor scores just 2/6 on our valuation checks. See what other red flags we found in the full valuation breakdown.
Approach 1: Honda Motor Discounted Cash Flow (DCF) Analysis
The Discounted Cash Flow (DCF) model estimates what a company is worth today by taking all of its expected future cash flows and discounting them back to the present. This method helps to determine the stock's intrinsic value compared to its market price.
For Honda Motor, the most recent Free Cash Flow (FCF) stands at a loss of about ¥310 billion. Looking ahead, analysts expect a turnaround. Over the next five years, FCF projections range between ¥454 billion and ¥1.12 trillion. Further estimates suggest Honda’s free cash generation will stabilize and gradually taper. By 2030, Simply Wall St projects Honda will generate FCF of roughly ¥889 billion. While analyst projections cover the next five years, estimates beyond that are modeled and less certain.
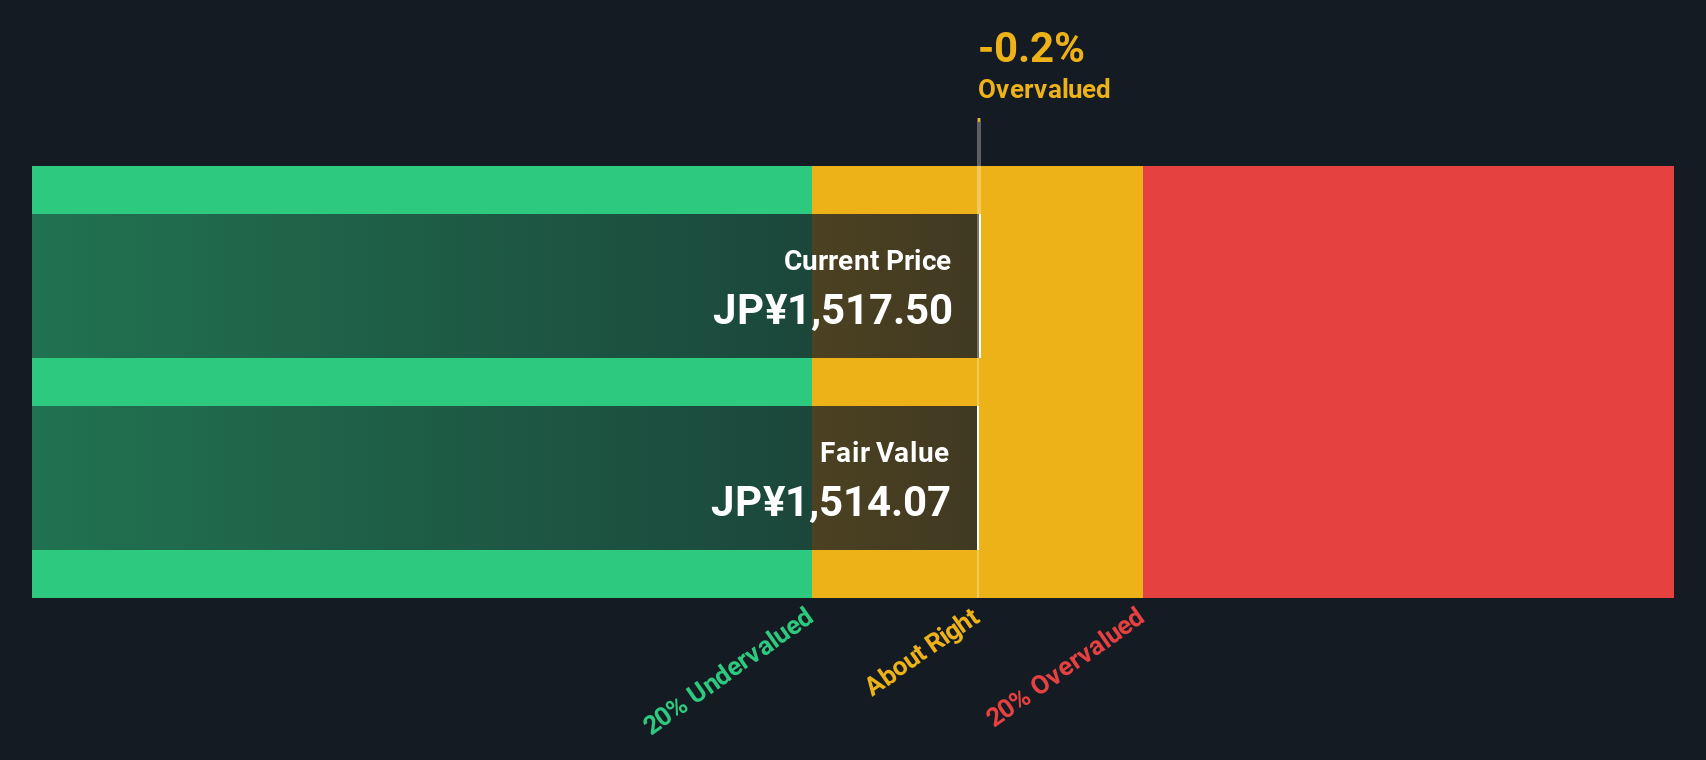
According to DCF analysis, the estimated fair value for Honda Motor stock is ¥1,539 per share. Comparing this to the current share price, the model indicates the stock is about 1.1% overvalued. With such a small difference between market price and intrinsic value, it is reasonable to say that Honda is fairly valued based on the DCF approach.
Result: ABOUT RIGHT
Simply Wall St performs a valuation analysis on every stock in the world every day (check out Honda Motor's valuation analysis). We show the entire calculation in full. You can track the result in your watchlist or portfolio and be alerted when this changes.
Approach 2: Honda Motor Price vs Earnings (PE Ratio)
The Price-to-Earnings (PE) ratio is a widely used valuation tool for profitable companies like Honda Motor because it connects the company's share price to its underlying earnings. For investors, the PE ratio offers a simple way to gauge how much the market is willing to pay for each unit of net income. This makes it a useful starting point for comparison.
Growth expectations and risk play a big role in deciding what a typical or “fair” PE should be. Companies expected to grow earnings quickly or facing less business risk often justify a higher PE, while slower growth or more risk can push the ratio down. Because of this, context is key when judging whether a PE is high or low.
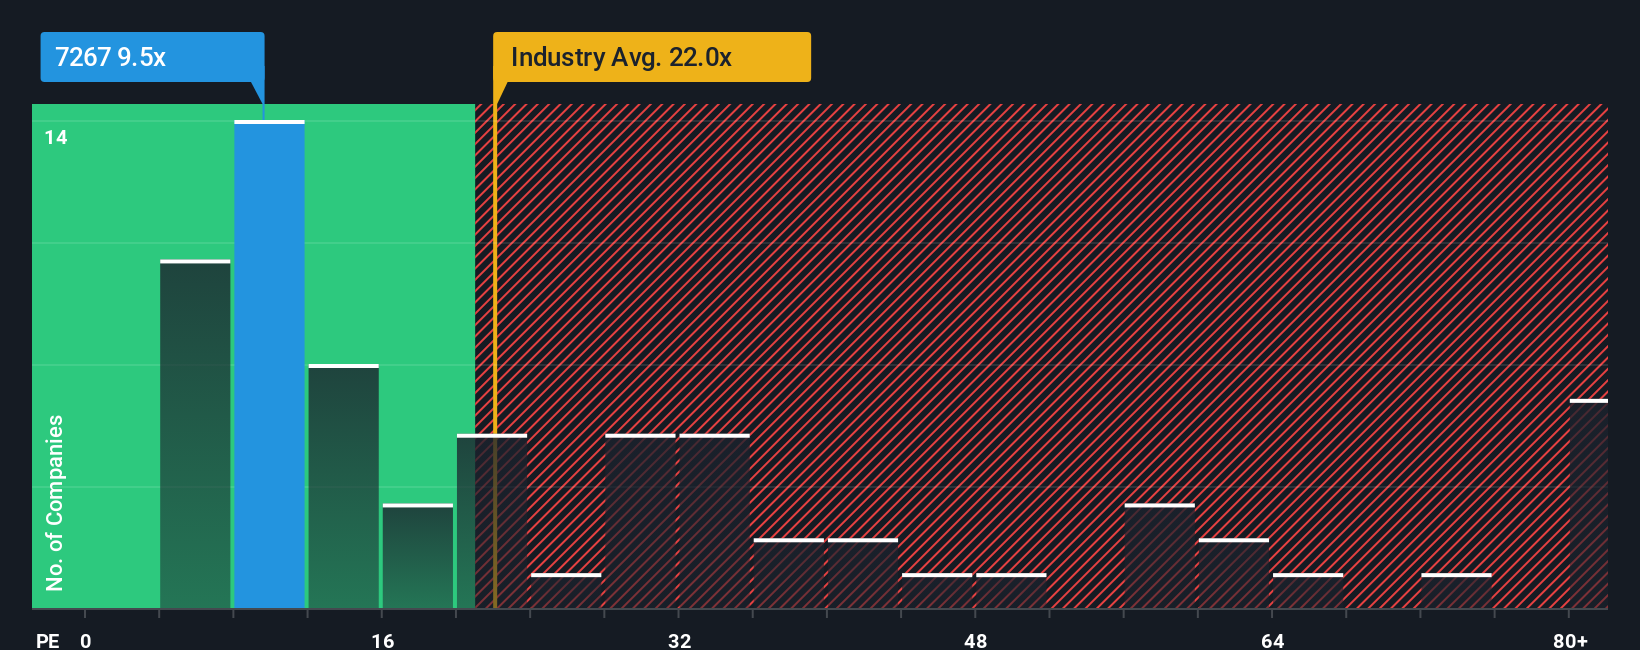
Honda Motor currently trades at a PE ratio of 9.5x. For context, this is just above its peer average of 9.3x but remains far below the Auto industry average of 19.0x. On the surface, that might suggest Honda is priced attractively. However, to get a true sense of value, Simply Wall St’s “Fair Ratio” takes the analysis further. The Fair Ratio is a data-driven benchmark that blends factors such as Honda’s earnings growth, profit margins, market capitalization, risk profile, and industry. Unlike a simple peer or industry comparison, the Fair Ratio offers a more personalized and relevant yardstick for valuation.
For Honda, the Fair Ratio is calculated as 17.8x. Since Honda’s actual PE ratio of 9.5x is significantly below this figure, it signals that the stock is trading at a notable discount relative to its long-term fundamentals.
Result: UNDERVALUED
PE ratios tell one story, but what if the real opportunity lies elsewhere? Discover companies where insiders are betting big on explosive growth.
Upgrade Your Decision Making: Choose your Honda Motor Narrative
Earlier we mentioned that there is an even better way to understand valuation, so let us introduce you to Narratives. A Narrative is your unique investment story or thesis, linking concrete business trends and forecasts such as revenue, margins, and fair value to your view on the company’s future, all in one place.
Narratives empower you to look past static numbers by adding your perspective behind the estimates, making it easy to map Honda Motor’s evolving outlook to your own assumptions. On Simply Wall St’s Community page, used by millions of investors, you can quickly set, adjust, and track your Narrative to make your decisions more personal, repeatable, and data-driven.
With Narratives, you decide when to buy or sell by directly comparing your dynamic fair value to the market price. Your view is also automatically updated when new news or earnings are released, so you’re always using the latest information.
For example, two investors might see Honda Motor very differently. One optimistic Narrative might build in strong hybrid demand and forecast a fair value near ¥1,900, while a cautious view might highlight EV competition and push fair value down to ¥1,400. This gives you a framework that adapts to changing facts and fits your conviction.
Do you think there's more to the story for Honda Motor? Create your own Narrative to let the Community know!
This article by Simply Wall St is general in nature. We provide commentary based on historical data and analyst forecasts only using an unbiased methodology and our articles are not intended to be financial advice. It does not constitute a recommendation to buy or sell any stock, and does not take account of your objectives, or your financial situation. We aim to bring you long-term focused analysis driven by fundamental data. Note that our analysis may not factor in the latest price-sensitive company announcements or qualitative material. Simply Wall St has no position in any stocks mentioned.
Valuation is complex, but we're here to simplify it.
Discover if Honda Motor might be undervalued or overvalued with our detailed analysis, featuring fair value estimates, potential risks, dividends, insider trades, and its financial condition.
Access Free AnalysisHave feedback on this article? Concerned about the content? Get in touch with us directly. Alternatively, email editorial-team@simplywallst.com
About TSE:7267
Honda Motor
Develops, manufactures, and distributes motorcycles, automobiles, and power products in Japan, North America, Europe, Asia, and internationally.
Established dividend payer and fair value.
Similar Companies
Market Insights

Advertisement
Community Narratives
Kodiak AI - a potential 100 bagger opportunity?
Fair Value US$14.00|44.7% undervalued
DA
Community Contributor
A Fair Price for a Great Business Facing Real Threats
Fair Value US$383.06|13.0% undervalued
IM
Community Contributor
AXON And Shopify Integration Will Unlock Global Mobile Advertising
Fair Value US$646.30|0% overvalued
AN
Based on Analyst Price Targets