Mazda Motor (TSE:7261) shares remained largely unchanged today, trading at ¥1042. While there was no major event moving the stock, investors continue to watch the automaker’s performance over the past month and recent quarters.
Mazda Motor has been treading water in recent months, reflecting a pattern seen across much of the auto sector. The bigger picture is more constructive. Its 1-year total shareholder return is essentially flat; however, the five-year total return of over 100% hints at substantial long-term value for investors who have stayed the course.
If you're following trends among automakers, take the next step and uncover more discoveries with our comprehensive list of See the full list for free.
With shares holding steady and solid long-term returns in the rearview mirror, the key question now is whether Mazda Motor is undervalued at current levels or if the market has already accounted for its future growth prospects.
Advertisement
Price-to-Earnings of 29.6x: Is it justified?
Mazda Motor currently trades at a price-to-earnings (P/E) ratio of 29.6x, which is notably higher than both its industry and peer group averages. This high multiple raises questions about whether the market is overestimating the company's potential for sustained profit growth at current levels.
The price-to-earnings ratio measures how much investors are willing to pay for each yen of Mazda Motor’s net income. In the auto sector, it is a widely used benchmark for evaluating whether shares are cheap or expensive relative to underlying profits and peers.
Despite optimistic forecasts for the company's future earnings growth, Mazda Motor’s P/E ratio of 29.6x is well above both the Asian auto industry average of 21.6x and the peer average of 21.8x. The SWS fair price-to-earnings ratio is estimated at 31.5x, suggesting that the current level is not excessively stretched but still high compared to the broader market and sector benchmarks.
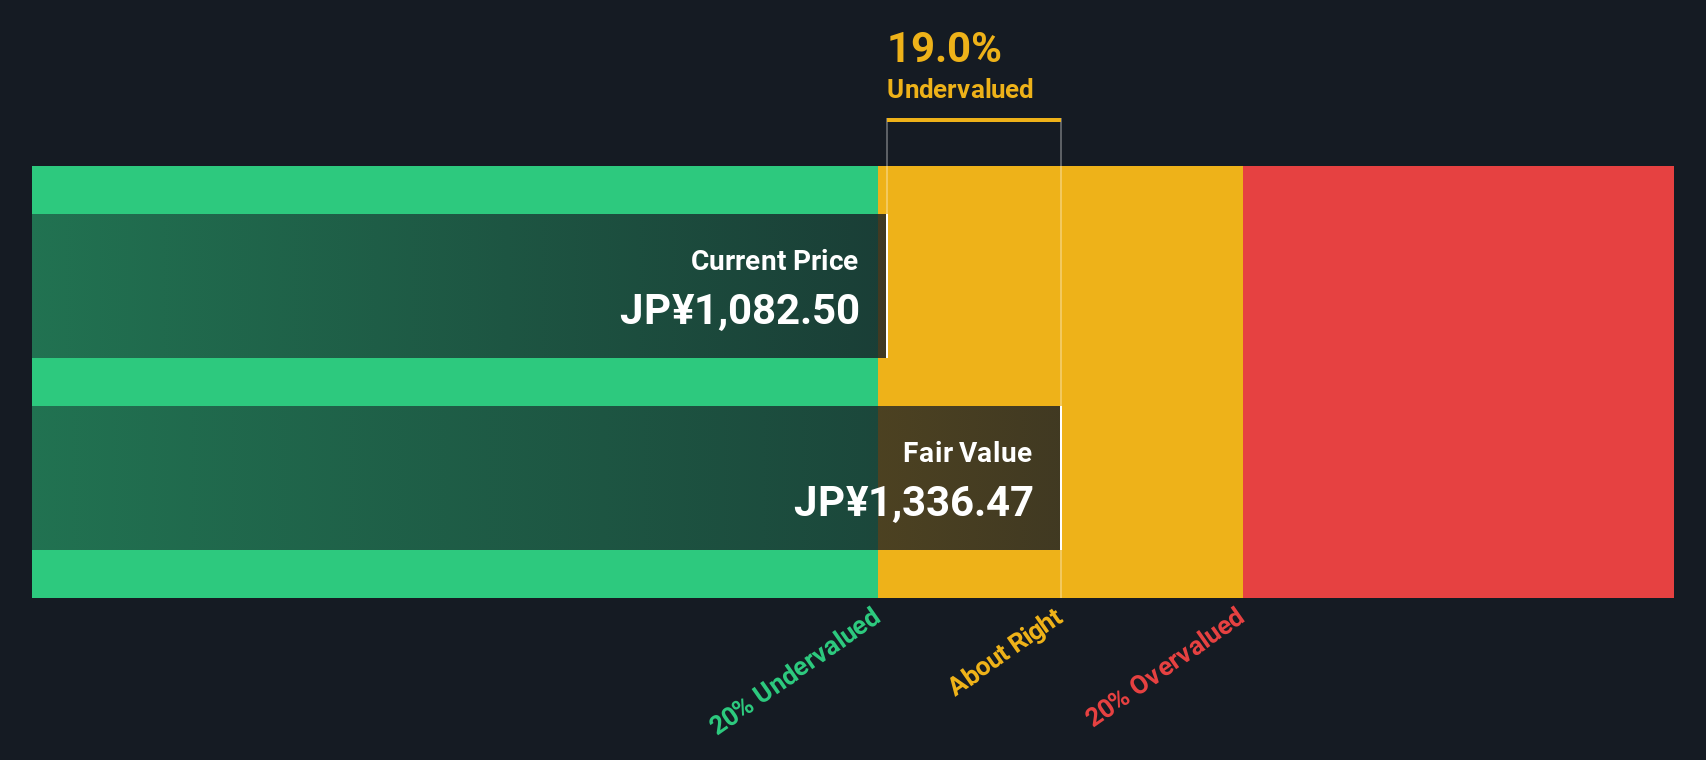
Another View: Discounted Cash Flow Tells a Different Story
While Mazda Motor’s current share price suggests it may be expensive compared to peers based on its earnings, our SWS DCF model values the company at ¥1336.47 per share, which is around 22% above where it trades now. This points to potential undervaluation using longer-term cash flow expectations.
Simply Wall St performs a discounted cash flow (DCF) on every stock in the world every day (check out Mazda Motor for example). We show the entire calculation in full. You can track the result in your watchlist or portfolio and be alerted when this changes, or use our stock screener to discover undervalued stocks based on their cash flows. If you save a screener we even alert you when new companies match - so you never miss a potential opportunity.
Build Your Own Mazda Motor Narrative
Readers who want to dive deeper or take a different approach to the numbers can craft their own investment scenario in just a few minutes. Do it your way.
Don’t limit your opportunities. See what else is out there. Our screeners highlight emerging potential, untapped value, and future growth stories in today’s market.
Spot fast-growing companies shaking up technology, AI, and automation by checking out these 24 AI penny stocks for tomorrow’s market leaders.
This article by Simply Wall St is general in nature. We provide commentary based on historical data
and analyst forecasts only using an unbiased methodology and our articles are not intended to be financial advice. It does not constitute a recommendation to buy or sell any stock, and does not take account of your objectives, or your
financial situation. We aim to bring you long-term focused analysis driven by fundamental data.
Note that our analysis may not factor in the latest price-sensitive company announcements or qualitative material.
Simply Wall St has no position in any stocks mentioned.
New: Manage All Your Stock Portfolios in One Place
We've created the ultimate portfolio companion for stock investors, and it's free.
• Connect an unlimited number of Portfolios and see your total in one currency • Be alerted to new Warning Signs or Risks via email or mobile • Track the Fair Value of your stocks