Advertisement
Evaluating Mazda After Five-Year 112% Surge and New Electrification Strategy for 2025

Simply Wall St
Reviewed by Bailey Pemberton
Thinking about what to do with Mazda Motor stock? You are certainly not alone. Whether you are a seasoned investor looking for the next big opportunity or just curious about the automaker's latest moves, recent trading patterns are giving everyone something to talk about. While Mazda’s share price has dipped slightly over the past week and month, with a 0.5% and 1.4% slide respectively, those numbers only tell part of the story. Pull back the lens a bit and you will see a remarkable surge: the stock is up 28.5% over three years, and an impressive 112.4% over five years. This longer-term momentum reflects underlying optimism in the company's strategy and its ability to adapt to changing market dynamics, such as shifts in consumer demand and advancements in automotive technology.
Of course, recent ups and downs may have also been shaped by market-wide developments, including fluctuating global demand and changing sentiment around automakers in general. Despite some short-term volatility, investors appear to be reassessing the broader risk and reward profile for companies like Mazda.
But what about Mazda’s valuation right now? Out of six respected valuation checks, Mazda Motor is considered undervalued in two, earning it a value score of 2. In the next sections, we will break down what these valuation approaches reveal. As we go, I will share an even better way to think about a company’s value, so stay tuned.
Mazda Motor scores just 2/6 on our valuation checks. See what other red flags we found in the full valuation breakdown.
Approach 1: Mazda Motor Discounted Cash Flow (DCF) Analysis
The Discounted Cash Flow (DCF) model estimates a company's value by forecasting its future cash flows and then discounting those projections back to today's value. Essentially, this approach tries to answer the question: what is all of Mazda Motor's expected future cash flow worth in today's terms?
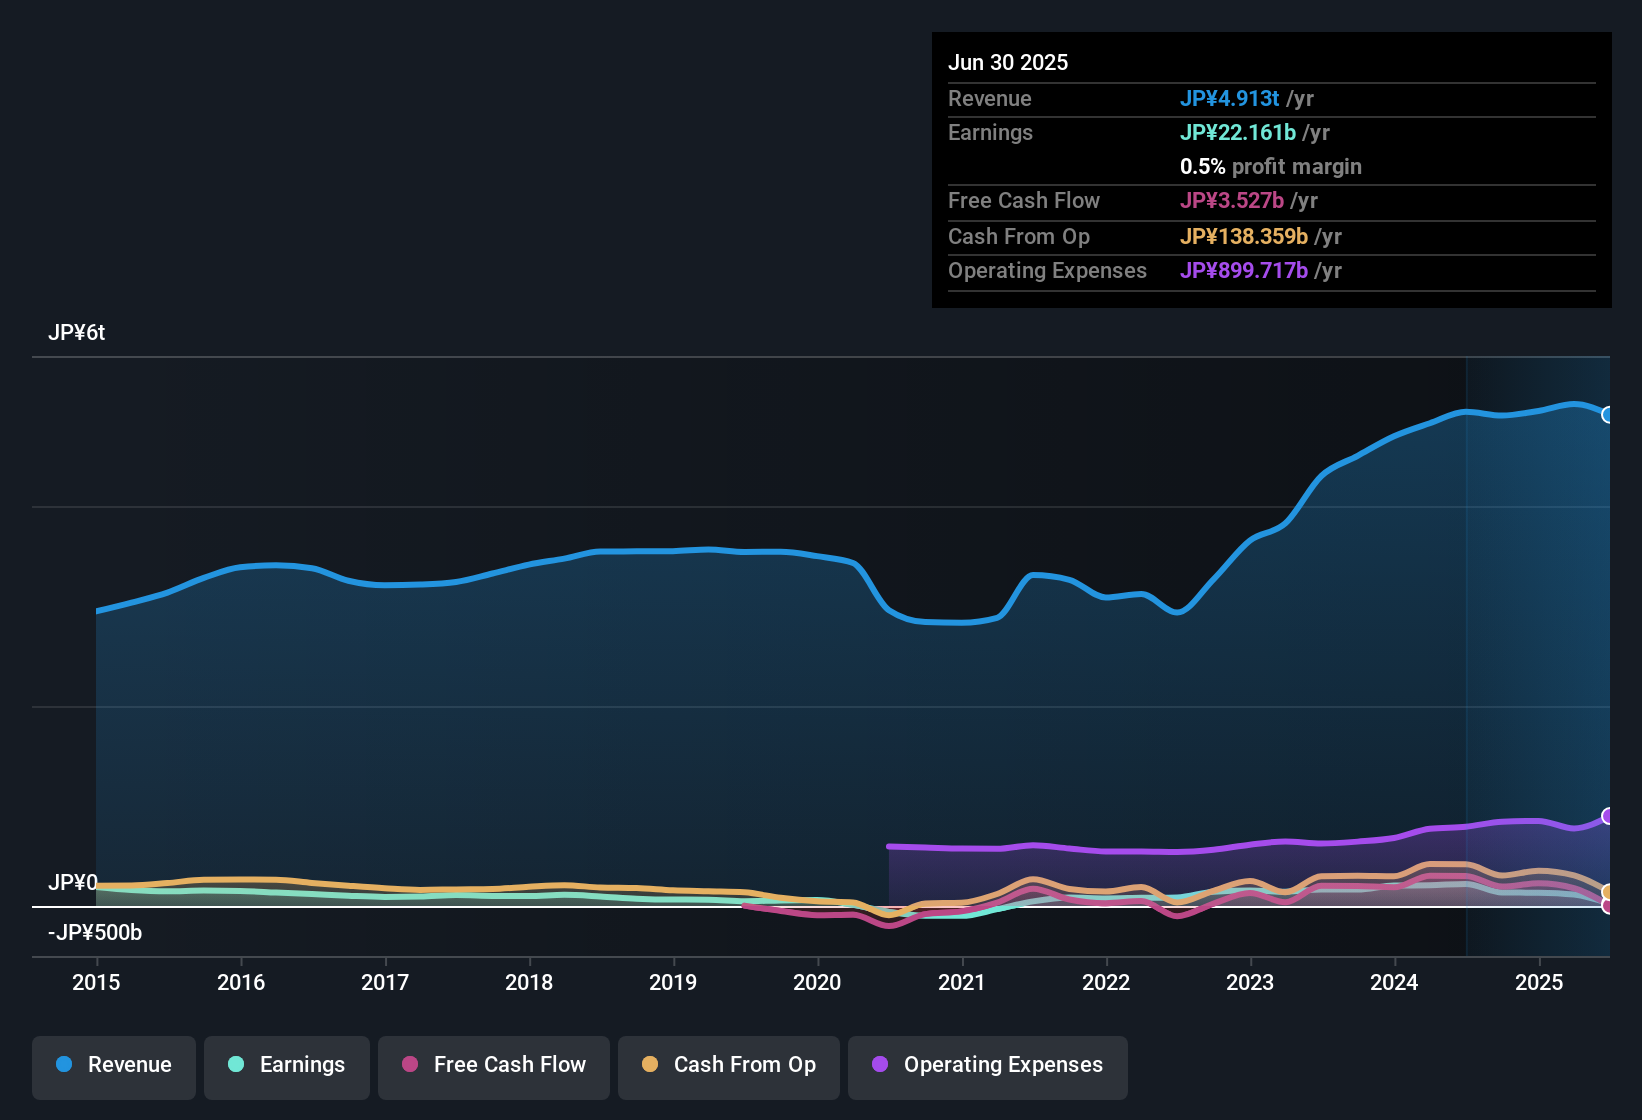
For Mazda Motor, the most recent reported Free Cash Flow (FCF) is approximately ¥18.1 billion. Analysts provide annual FCF estimates for the next five years, but beyond that, projections are extrapolated using reasonable growth assumptions. By 2030, the DCF projection sees Mazda Motor generating upwards of ¥85.9 billion in Free Cash Flow annually. Cash flows continue to rise in subsequent years, largely reflecting optimism in both operational efficiency and ongoing industry relevance.
Using the two-stage Free Cash Flow to Equity model, these estimates are discounted back to the present day. The resulting intrinsic value for Mazda Motor comes out to ¥1,336 per share. Notably, this valuation implies that the stock is currently trading at a 19.0% discount to its true value, which may signal potential upside for investors who share in these assumptions.
Result: UNDERVALUED
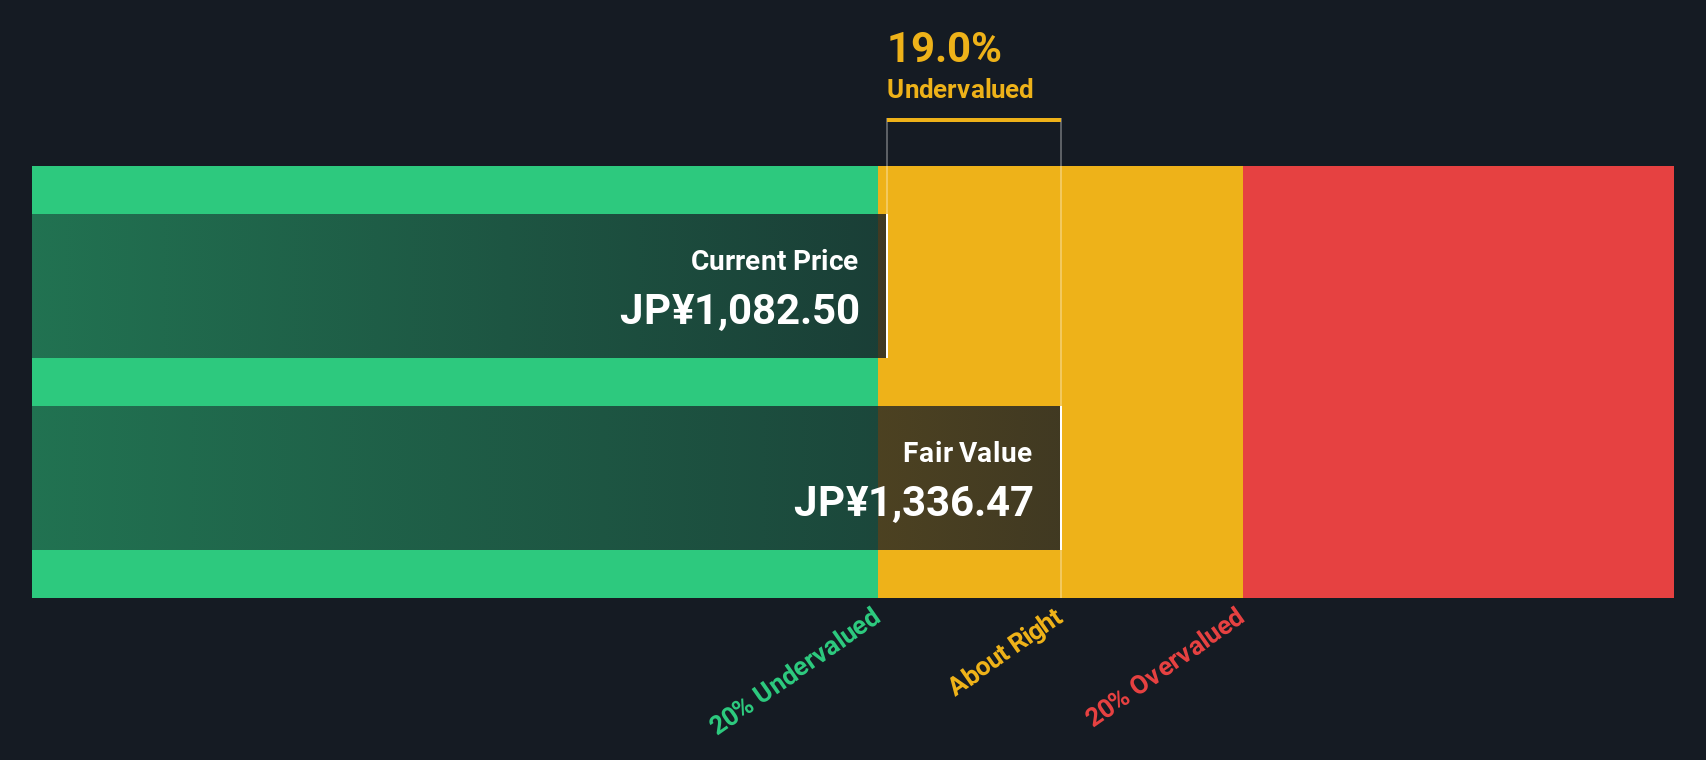
Our Discounted Cash Flow (DCF) analysis suggests Mazda Motor is undervalued by 19.0%. Track this in your watchlist or portfolio, or discover more undervalued stocks.
Approach 2: Mazda Motor Price vs Earnings (P/E)
The Price-to-Earnings (P/E) ratio is a widely used valuation metric for profitable companies because it offers a quick way to assess how much the market is willing to pay for each unit of a company’s earnings. For companies generating consistent profits, like Mazda Motor, the P/E ratio provides insight into investor expectations for future growth and the perceived risks surrounding the business.
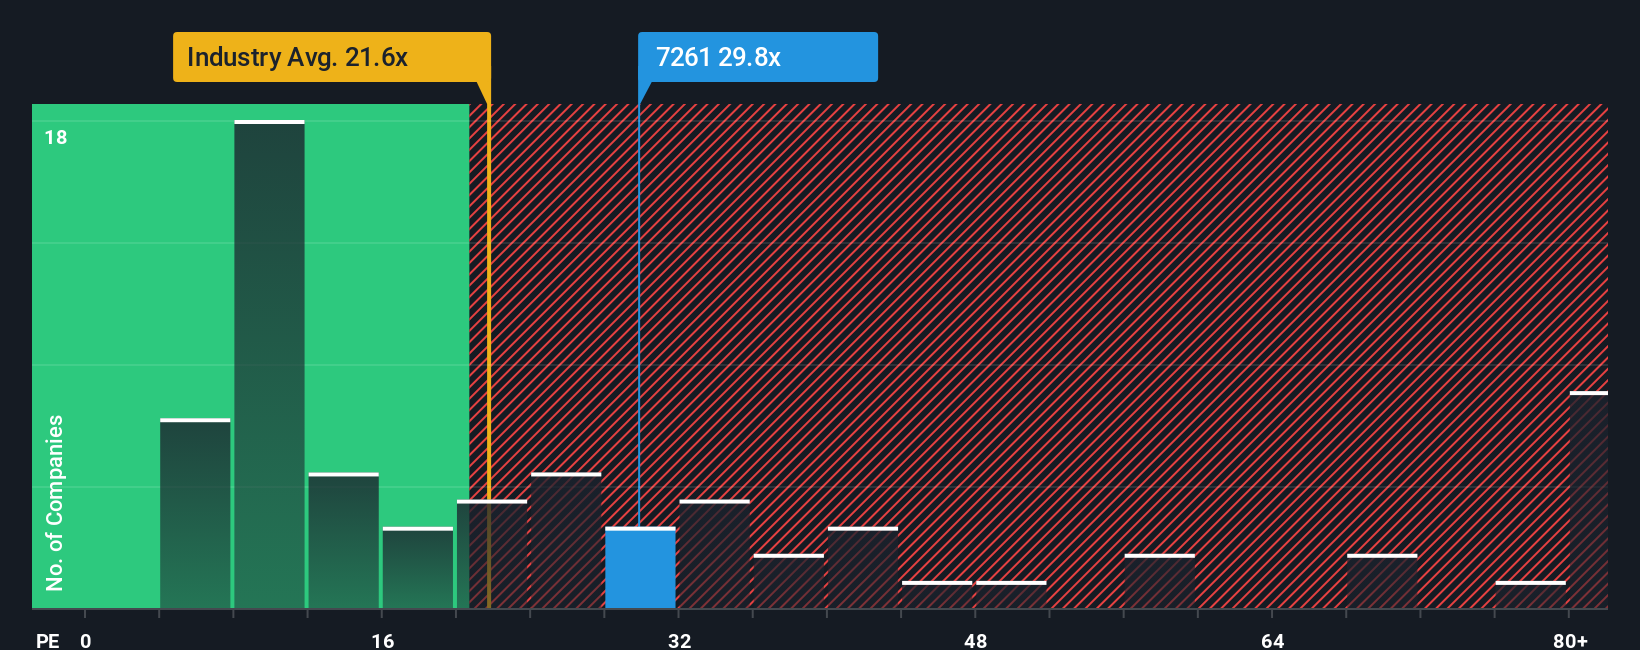
Growth prospects and risk profiles play a big role in determining what constitutes a "normal" or "fair" P/E ratio. Companies expected to accelerate earnings growth typically trade at higher multiples, while those facing higher uncertainty or slower growth command lower ratios in the market. As of now, Mazda Motor trades at a P/E of 30.8x. For context, this stands well above the automotive industry average of 18.0x and the peer group average of 22.4x, signaling market optimism or confidence in Mazda’s outlook compared to its rivals.
Beyond simple benchmark comparisons, Simply Wall St’s “Fair Ratio” provides a custom yardstick. In this case, the Fair Ratio is 31.5x and factors in Mazda’s unique growth forecasts, profit margins, industry profile, size, and specific company risks. This Fair Ratio avoids the pitfalls of blanket industry or peer comparisons by tailoring what a justifiable multiple should look like for Mazda Motor today. Since the company’s actual P/E (30.8x) is nearly identical to its Fair Ratio, it suggests that the stock’s price in relation to current earnings is well calibrated to its fundamentals.
Result: ABOUT RIGHT
PE ratios tell one story, but what if the real opportunity lies elsewhere? Discover companies where insiders are betting big on explosive growth.
Upgrade Your Decision Making: Choose your Mazda Motor Narrative
Earlier we mentioned that there is an even better way to understand valuation. Let’s introduce you to Narratives. A Narrative is your chance to define the story behind the numbers, connecting your own perspective on a company’s future with financial forecasts and a calculated fair value. Instead of just relying on static metrics, Narratives bring your assumptions about Mazda Motor’s revenue, earnings, and margins into a clear, dynamic framework that’s easy to use, right on Simply Wall St’s Community page, where millions of investors share their views.
This approach helps you decide exactly when to buy or sell by directly comparing your Fair Value to the live share price. Narratives also update automatically as new data comes in, so your investment thesis evolves with the latest news and earnings. For example, on Mazda Motor, some investors might see ambitious growth ahead and set a higher fair value, while others, more cautious, might expect a lower one. With Narratives, you are in control, making smarter, more adaptable decisions anchored in your unique outlook.
Do you think there's more to the story for Mazda Motor? Create your own Narrative to let the Community know!
This article by Simply Wall St is general in nature. We provide commentary based on historical data and analyst forecasts only using an unbiased methodology and our articles are not intended to be financial advice. It does not constitute a recommendation to buy or sell any stock, and does not take account of your objectives, or your financial situation. We aim to bring you long-term focused analysis driven by fundamental data. Note that our analysis may not factor in the latest price-sensitive company announcements or qualitative material. Simply Wall St has no position in any stocks mentioned.
New: Manage All Your Stock Portfolios in One Place
We've created the ultimate portfolio companion for stock investors, and it's free.
• Connect an unlimited number of Portfolios and see your total in one currency
• Be alerted to new Warning Signs or Risks via email or mobile
• Track the Fair Value of your stocks
Have feedback on this article? Concerned about the content? Get in touch with us directly. Alternatively, email editorial-team@simplywallst.com
About TSE:7261
Mazda Motor
Engages in the manufacture and sale of passenger cars and commercial vehicles in Japan, North America, Europe, the United States, and internationally.
Flawless balance sheet with slight risk.
Similar Companies
Market Insights

Advertisement
Community Narratives
The Next Phase of Energy Storage: How NeoVolta Is Tackling America’s Power Crunch
Fair Value US$7.50|35.1% undervalued
MA
Community Contributor
Why EnSilica is Worth Possibly 13x its Current Price
Fair Value UK£5.00|89.5% undervalued
DO
Community Contributor
M&A Activity, Industry Diversification & A Defense Contract Monopoly Will Push BWXT For Healthy Long-Term Growth
Fair Value US$220.00|15.2% undervalued
CL
Community Contributor
A case for Cassiar Gold Corp (TSXV: GLDC) to reach CAD$8-10 before 2030 (X30-37)
Fair Value CA$10.00|96.0% undervalued
AG
Community Contributor