
Advertisement
Toyota Motor (TSE:7203) sheds 3.3% this week, as yearly returns fall more in line with earnings growth
Toyota Motor Corporation (TSE:7203) shareholders might be concerned after seeing the share price drop 11% in the last quarter. On the bright side the share price is up over the last half decade. Unfortunately its return of 84% is below the market return of 86%. Unfortunately not all shareholders will have held it for the long term, so spare a thought for those caught in the 17% decline over the last twelve months.
Although Toyota Motor has shed JP¥1.1t from its market cap this week, let's take a look at its longer term fundamental trends and see if they've driven returns.
There is no denying that markets are sometimes efficient, but prices do not always reflect underlying business performance. By comparing earnings per share (EPS) and share price changes over time, we can get a feel for how investor attitudes to a company have morphed over time.
Over half a decade, Toyota Motor managed to grow its earnings per share at 20% a year. This EPS growth is higher than the 13% average annual increase in the share price. Therefore, it seems the market has become relatively pessimistic about the company. This cautious sentiment is reflected in its (fairly low) P/E ratio of 7.03.
You can see below how EPS has changed over time (discover the exact values by clicking on the image).
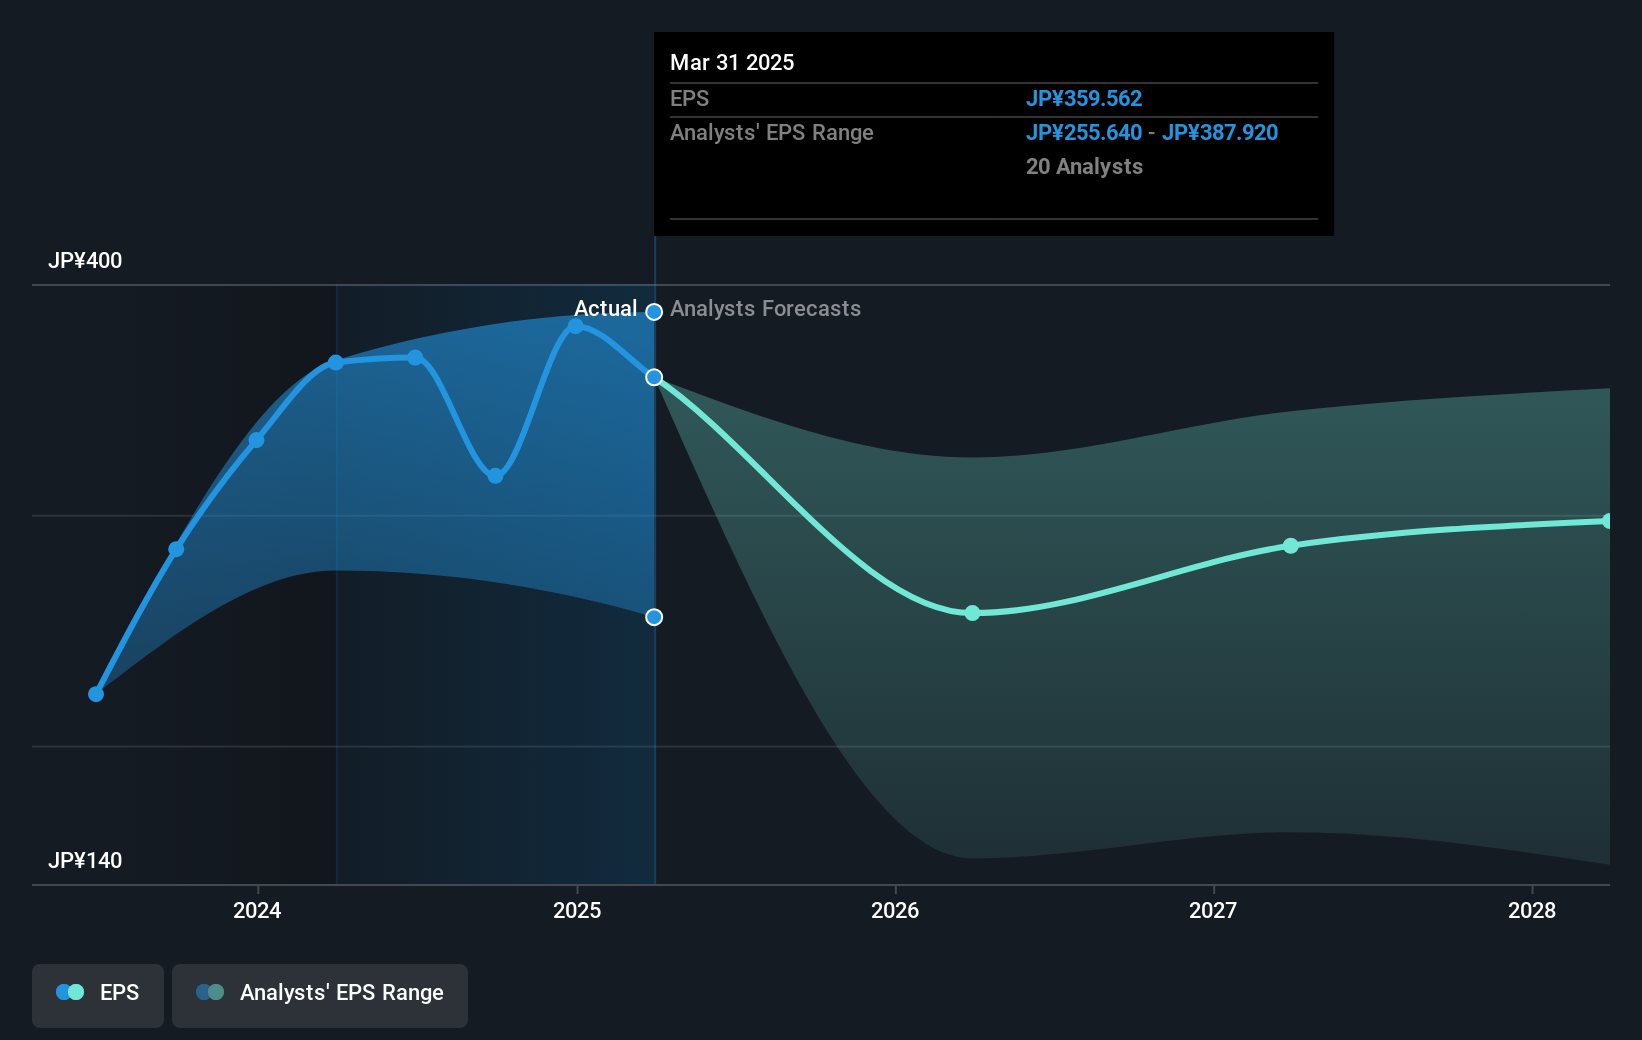
This free interactive report on Toyota Motor's earnings, revenue and cash flow is a great place to start, if you want to investigate the stock further.
What About Dividends?
When looking at investment returns, it is important to consider the difference between total shareholder return (TSR) and share price return. The TSR incorporates the value of any spin-offs or discounted capital raisings, along with any dividends, based on the assumption that the dividends are reinvested. So for companies that pay a generous dividend, the TSR is often a lot higher than the share price return. In the case of Toyota Motor, it has a TSR of 112% for the last 5 years. That exceeds its share price return that we previously mentioned. This is largely a result of its dividend payments!
A Different Perspective
While the broader market gained around 5.9% in the last year, Toyota Motor shareholders lost 15% (even including dividends). However, keep in mind that even the best stocks will sometimes underperform the market over a twelve month period. On the bright side, long term shareholders have made money, with a gain of 16% per year over half a decade. If the fundamental data continues to indicate long term sustainable growth, the current sell-off could be an opportunity worth considering. I find it very interesting to look at share price over the long term as a proxy for business performance. But to truly gain insight, we need to consider other information, too. For example, we've discovered 3 warning signs for Toyota Motor (2 are significant!) that you should be aware of before investing here.
We will like Toyota Motor better if we see some big insider buys. While we wait, check out this free list of undervalued stocks (mostly small caps) with considerable, recent, insider buying.
Please note, the market returns quoted in this article reflect the market weighted average returns of stocks that currently trade on Japanese exchanges.
Valuation is complex, but we're here to simplify it.
Discover if Toyota Motor might be undervalued or overvalued with our detailed analysis, featuring fair value estimates, potential risks, dividends, insider trades, and its financial condition.
Access Free AnalysisHave feedback on this article? Concerned about the content? Get in touch with us directly. Alternatively, email editorial-team (at) simplywallst.com.
This article by Simply Wall St is general in nature. We provide commentary based on historical data and analyst forecasts only using an unbiased methodology and our articles are not intended to be financial advice. It does not constitute a recommendation to buy or sell any stock, and does not take account of your objectives, or your financial situation. We aim to bring you long-term focused analysis driven by fundamental data. Note that our analysis may not factor in the latest price-sensitive company announcements or qualitative material. Simply Wall St has no position in any stocks mentioned.
About TSE:7203
Toyota Motor
Designs, manufactures, assembles, and sells passenger vehicles, minivans and commercial vehicles, and related parts and accessories in Japan, North America, Europe, Asia, Central and South America, Oceania, Africa, and the Middle East.
Average dividend payer and fair value.
Similar Companies
Market Insights

Advertisement
Community Narratives
Vita Life Sciences Set for a 12.72% Revenue Growth While Tackling Operational Challenges
Fair Value AU$2.42|9.1% undervalued
RO
Community Contributor
Vossloh rides a €500 billion wave to boost growth and earnings in the next decade
Fair Value €78.41|6.1% undervalued
CH
Community Contributor
Intuitive Surgical Will Transform Healthcare with 12% Revenue Growth
Fair Value US$325.55|56.5% overvalued
UN
Community Contributor