

Sanden Corporation (TSE:6444) shares have retraced a considerable 26% in the last month, reversing a fair amount of their solid recent performance. The drop over the last 30 days has capped off a tough year for shareholders, with the share price down 17% in that time.
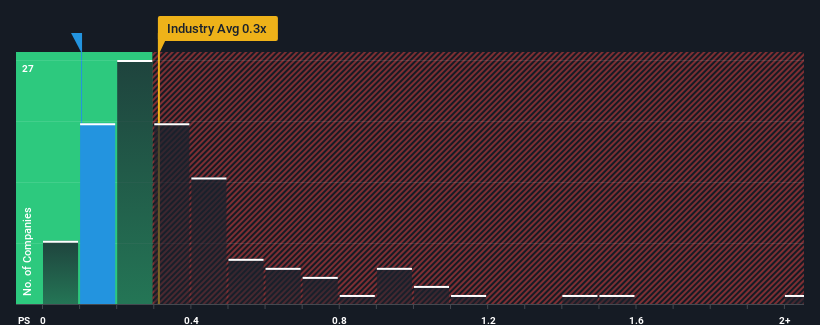
In spite of the heavy fall in price, you could still be forgiven for feeling indifferent about Sanden's P/S ratio of 0.1x, since the median price-to-sales (or "P/S") ratio for the Auto Components industry in Japan is also close to 0.3x. While this might not raise any eyebrows, if the P/S ratio is not justified investors could be missing out on a potential opportunity or ignoring looming disappointment.
Check out our latest analysis for Sanden
How Sanden Has Been Performing
It looks like revenue growth has deserted Sanden recently, which is not something to boast about. One possibility is that the P/S is moderate because investors think this benign revenue growth rate might not be enough to outperform the broader industry in the near future. If not, then existing shareholders may be feeling hopeful about the future direction of the share price.
Want the full picture on earnings, revenue and cash flow for the company? Then our free report on Sanden will help you shine a light on its historical performance.How Is Sanden's Revenue Growth Trending?
In order to justify its P/S ratio, Sanden would need to produce growth that's similar to the industry.
Taking a look back first, we see that there was hardly any revenue growth to speak of for the company over the past year. Still, the latest three year period has seen an excellent 35% overall rise in revenue, in spite of its uninspiring short-term performance. Accordingly, shareholders will be pleased, but also have some questions to ponder about the last 12 months.
This is in contrast to the rest of the industry, which is expected to grow by 4.1% over the next year, materially lower than the company's recent medium-term annualised growth rates.
With this information, we find it interesting that Sanden is trading at a fairly similar P/S compared to the industry. Apparently some shareholders believe the recent performance is at its limits and have been accepting lower selling prices.
What Does Sanden's P/S Mean For Investors?
With its share price dropping off a cliff, the P/S for Sanden looks to be in line with the rest of the Auto Components industry. We'd say the price-to-sales ratio's power isn't primarily as a valuation instrument but rather to gauge current investor sentiment and future expectations.
To our surprise, Sanden revealed its three-year revenue trends aren't contributing to its P/S as much as we would have predicted, given they look better than current industry expectations. There could be some unobserved threats to revenue preventing the P/S ratio from matching this positive performance. At least the risk of a price drop looks to be subdued if recent medium-term revenue trends continue, but investors seem to think future revenue could see some volatility.
And what about other risks? Every company has them, and we've spotted 1 warning sign for Sanden you should know about.
It's important to make sure you look for a great company, not just the first idea you come across. So if growing profitability aligns with your idea of a great company, take a peek at this free list of interesting companies with strong recent earnings growth (and a low P/E).
If you're looking to trade Sanden, open an account with the lowest-cost platform trusted by professionals, Interactive Brokers.
With clients in over 200 countries and territories, and access to 160 markets, IBKR lets you trade stocks, options, futures, forex, bonds and funds from a single integrated account.
Enjoy no hidden fees, no account minimums, and FX conversion rates as low as 0.03%, far better than what most brokers offer.
Sponsored ContentNew: Manage All Your Stock Portfolios in One Place
We've created the ultimate portfolio companion for stock investors, and it's free.
• Connect an unlimited number of Portfolios and see your total in one currency
• Be alerted to new Warning Signs or Risks via email or mobile
• Track the Fair Value of your stocks
Have feedback on this article? Concerned about the content? Get in touch with us directly. Alternatively, email editorial-team (at) simplywallst.com.
This article by Simply Wall St is general in nature. We provide commentary based on historical data and analyst forecasts only using an unbiased methodology and our articles are not intended to be financial advice. It does not constitute a recommendation to buy or sell any stock, and does not take account of your objectives, or your financial situation. We aim to bring you long-term focused analysis driven by fundamental data. Note that our analysis may not factor in the latest price-sensitive company announcements or qualitative material. Simply Wall St has no position in any stocks mentioned.
About TSE:6444
Sanden
Manufactures and sells automotive systems in Japan and internationally.
Mediocre balance sheet and slightly overvalued.

