
Advertisement
- Japan
- /
- Auto Components
- /
- TSE:5108
Has Bridgestone Corporation's (TSE:5108) Impressive Stock Performance Got Anything to Do With Its Fundamentals?
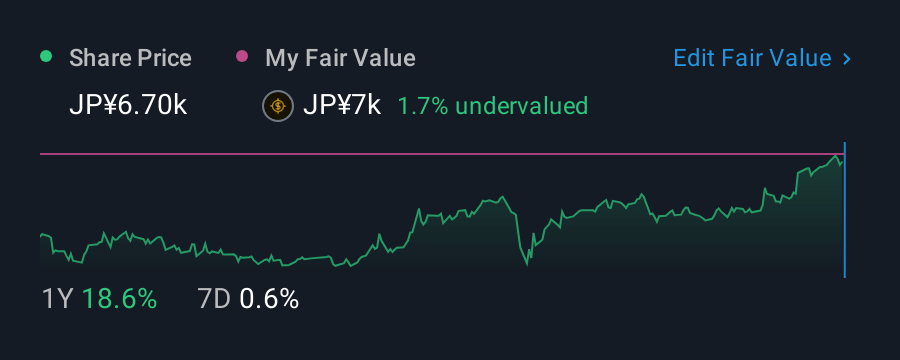
Bridgestone (TSE:5108) has had a great run on the share market with its stock up by a significant 9.1% over the last month. We wonder if and what role the company's financials play in that price change as a company's long-term fundamentals usually dictate market outcomes. In this article, we decided to focus on Bridgestone's ROE.
Return on equity or ROE is a key measure used to assess how efficiently a company's management is utilizing the company's capital. In short, ROE shows the profit each dollar generates with respect to its shareholder investments.
How To Calculate Return On Equity?
The formula for return on equity is:
Return on Equity = Net Profit (from continuing operations) ÷ Shareholders' Equity
So, based on the above formula, the ROE for Bridgestone is:
5.9% = JP¥208b ÷ JP¥3.5t (Based on the trailing twelve months to June 2025).
The 'return' is the income the business earned over the last year. That means that for every ¥1 worth of shareholders' equity, the company generated ¥0.06 in profit.
Check out our latest analysis for Bridgestone
What Has ROE Got To Do With Earnings Growth?
So far, we've learned that ROE is a measure of a company's profitability. Depending on how much of these profits the company reinvests or "retains", and how effectively it does so, we are then able to assess a company’s earnings growth potential. Generally speaking, other things being equal, firms with a high return on equity and profit retention, have a higher growth rate than firms that don’t share these attributes.
Bridgestone's Earnings Growth And 5.9% ROE
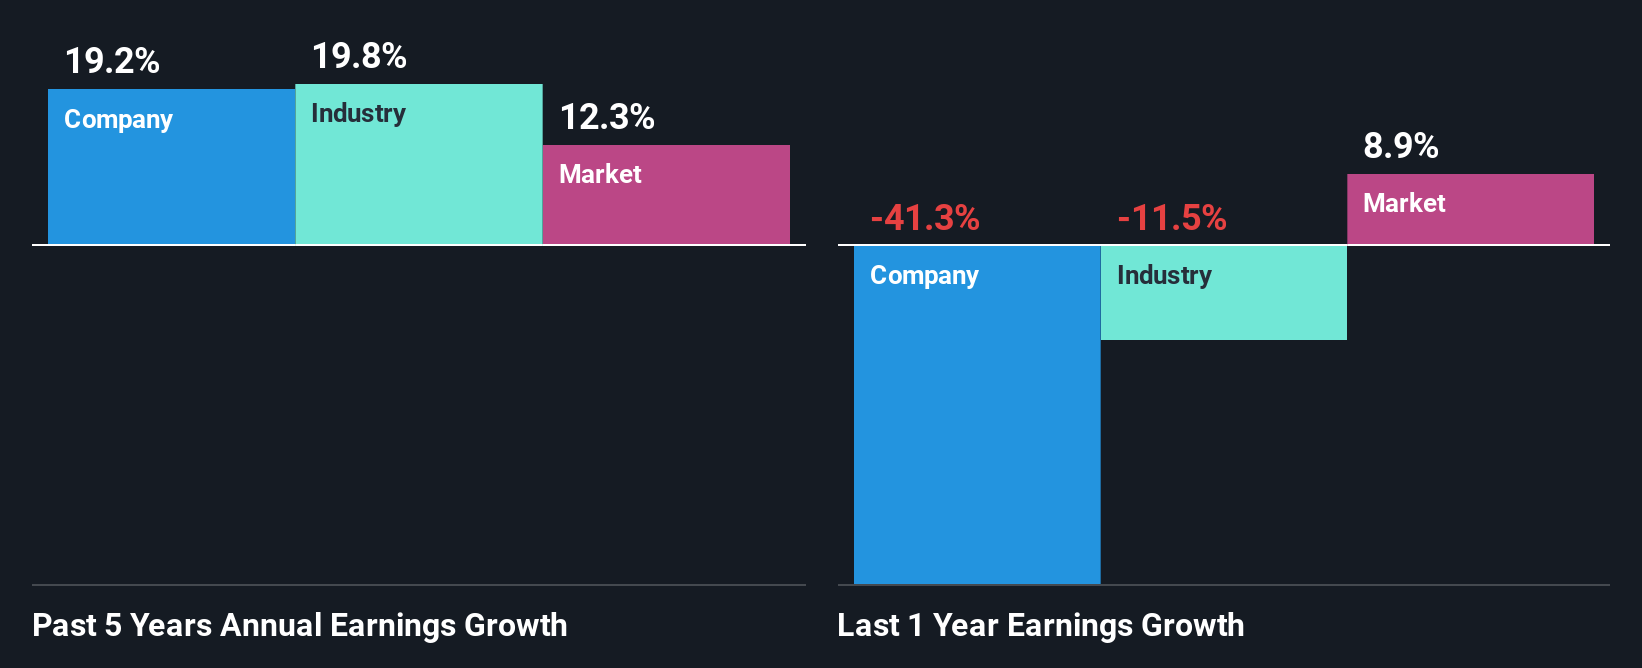
At first glance, Bridgestone's ROE doesn't look very promising. Yet, a closer study shows that the company's ROE is similar to the industry average of 6.5%. On the other hand, Bridgestone reported a moderate 19% net income growth over the past five years. Taking into consideration that the ROE is not particularly high, we reckon that there could also be other factors at play which could be influencing the company's growth. Such as - high earnings retention or an efficient management in place.
As a next step, we compared Bridgestone's net income growth with the industry and found that the company has a similar growth figure when compared with the industry average growth rate of 20% in the same period.
The basis for attaching value to a company is, to a great extent, tied to its earnings growth. The investor should try to establish if the expected growth or decline in earnings, whichever the case may be, is priced in. This then helps them determine if the stock is placed for a bright or bleak future. Has the market priced in the future outlook for 5108? You can find out in our latest intrinsic value infographic research report.
Is Bridgestone Efficiently Re-investing Its Profits?
Bridgestone has a three-year median payout ratio of 41%, which implies that it retains the remaining 59% of its profits. This suggests that its dividend is well covered, and given the decent growth seen by the company, it looks like management is reinvesting its earnings efficiently.
Besides, Bridgestone has been paying dividends for at least ten years or more. This shows that the company is committed to sharing profits with its shareholders.
Conclusion
In total, it does look like Bridgestone has some positive aspects to its business. Despite its low rate of return, the fact that the company reinvests a very high portion of its profits into its business, no doubt contributed to its high earnings growth. We also studied the latest analyst forecasts and found that the company's earnings growth is expected be similar to its current growth rate. To know more about the company's future earnings growth forecasts take a look at this free report on analyst forecasts for the company to find out more.
Valuation is complex, but we're here to simplify it.
Discover if Bridgestone might be undervalued or overvalued with our detailed analysis, featuring fair value estimates, potential risks, dividends, insider trades, and its financial condition.
Access Free AnalysisHave feedback on this article? Concerned about the content? Get in touch with us directly. Alternatively, email editorial-team (at) simplywallst.com.
This article by Simply Wall St is general in nature. We provide commentary based on historical data and analyst forecasts only using an unbiased methodology and our articles are not intended to be financial advice. It does not constitute a recommendation to buy or sell any stock, and does not take account of your objectives, or your financial situation. We aim to bring you long-term focused analysis driven by fundamental data. Note that our analysis may not factor in the latest price-sensitive company announcements or qualitative material. Simply Wall St has no position in any stocks mentioned.
About TSE:5108
Flawless balance sheet average dividend payer.
Similar Companies
Market Insights

Advertisement
Community Narratives
Quality at a Premium. A time to watch, not to buy?
Fair Value US$154.56|30.1% undervalued
DA
Community Contributor
GRAB: The Super-App at the Heart of Southeast Asia’s Digital Boom
Fair Value US$8.20|25.6% undervalued
BL
Community Contributor
Verve Group to Surge with 51.61% Revenue Growth
Fair Value €6.00|63.2% undervalued
ME
Community Contributor