
Advertisement
As SeSa (BIT:SES) climbs 6.6% this past week, investors may now be noticing the company's three-year earnings growth

If you are building a properly diversified stock portfolio, the chances are some of your picks will perform badly. But long term SeSa S.p.A. (BIT:SES) shareholders have had a particularly rough ride in the last three year. So they might be feeling emotional about the 60% share price collapse, in that time. And over the last year the share price fell 48%, so we doubt many shareholders are delighted. Furthermore, it's down 28% in about a quarter. That's not much fun for holders. This could be related to the recent financial results - you can catch up on the most recent data by reading our company report.
While the stock has risen 6.6% in the past week but long term shareholders are still in the red, let's see what the fundamentals can tell us.
Check out our latest analysis for SeSa
While markets are a powerful pricing mechanism, share prices reflect investor sentiment, not just underlying business performance. One way to examine how market sentiment has changed over time is to look at the interaction between a company's share price and its earnings per share (EPS).
Although the share price is down over three years, SeSa actually managed to grow EPS by 2.0% per year in that time. This is quite a puzzle, and suggests there might be something temporarily buoying the share price. Or else the company was over-hyped in the past, and so its growth has disappointed.
It's pretty reasonable to suspect the market was previously to bullish on the stock, and has since moderated expectations. Looking to other metrics might better explain the share price change.
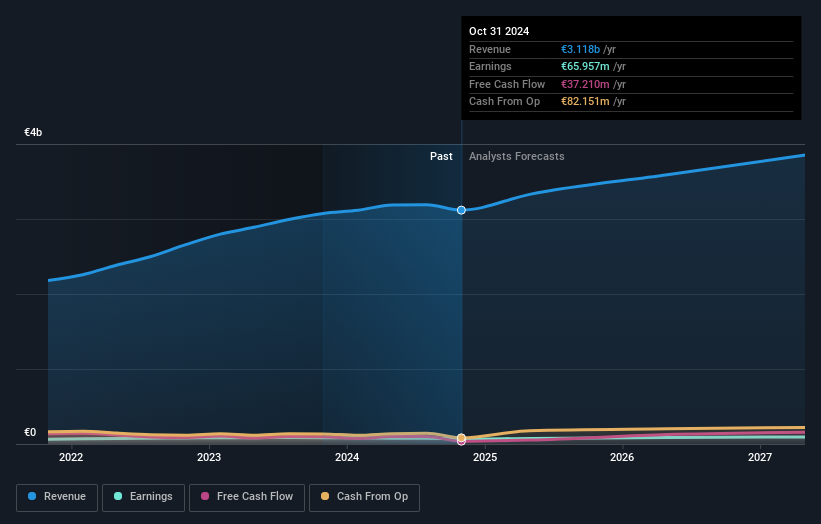
The modest 1.6% dividend yield is unlikely to be guiding the market view of the stock. Revenue is actually up 13% over the three years, so the share price drop doesn't seem to hinge on revenue, either. This analysis is just perfunctory, but it might be worth researching SeSa more closely, as sometimes stocks fall unfairly. This could present an opportunity.
The graphic below depicts how earnings and revenue have changed over time (unveil the exact values by clicking on the image).
Take a more thorough look at SeSa's financial health with this free report on its balance sheet.
A Different Perspective
SeSa shareholders are down 48% for the year (even including dividends), but the market itself is up 23%. However, keep in mind that even the best stocks will sometimes underperform the market over a twelve month period. Longer term investors wouldn't be so upset, since they would have made 4%, each year, over five years. It could be that the recent sell-off is an opportunity, so it may be worth checking the fundamental data for signs of a long term growth trend. It's always interesting to track share price performance over the longer term. But to understand SeSa better, we need to consider many other factors. Consider risks, for instance. Every company has them, and we've spotted 1 warning sign for SeSa you should know about.
For those who like to find winning investments this free list of undervalued companies with recent insider purchasing, could be just the ticket.
Please note, the market returns quoted in this article reflect the market weighted average returns of stocks that currently trade on Italian exchanges.
New: Manage All Your Stock Portfolios in One Place
We've created the ultimate portfolio companion for stock investors, and it's free.
• Connect an unlimited number of Portfolios and see your total in one currency
• Be alerted to new Warning Signs or Risks via email or mobile
• Track the Fair Value of your stocks
Have feedback on this article? Concerned about the content? Get in touch with us directly. Alternatively, email editorial-team (at) simplywallst.com.
This article by Simply Wall St is general in nature. We provide commentary based on historical data and analyst forecasts only using an unbiased methodology and our articles are not intended to be financial advice. It does not constitute a recommendation to buy or sell any stock, and does not take account of your objectives, or your financial situation. We aim to bring you long-term focused analysis driven by fundamental data. Note that our analysis may not factor in the latest price-sensitive company announcements or qualitative material. Simply Wall St has no position in any stocks mentioned.
About BIT:SES
SeSa
Distributes value-added information technology (IT) software and technologies in Italy and internationally.
Good value with adequate balance sheet.
Market Insights

Advertisement
Community Narratives
WhiteCap Is Positioned To Profit Regardless Of Trump's Policy 
Fair Value CA$22.60|61.6% undervalued
ST
Equity Analyst and Writer
Microsoft's Evolution Will Drive Revenue to New Heights Fueled by AI
Fair Value US$360.00|28.3% overvalued
BR
Community Contributor
A CASE FOR USD$2.50 (CAD$3.44) BY 2028 (A 5-10 BAGGER)
Fair Value CA$3.44|87.8% undervalued
AG
Community Contributor