Optimism for Masi Agricola (BIT:MASI) has grown this past week, despite three-year decline in earnings


One simple way to benefit from the stock market is to buy an index fund. But if you choose individual stocks with prowess, you can make superior returns. For example, the Masi Agricola S.p.A. (BIT:MASI) share price is up 97% in the last three years, clearly besting the market decline of around 5.3% (not including dividends). On the other hand, the returns haven't been quite so good recently, with shareholders up just 20% , including dividends .
After a strong gain in the past week, it's worth seeing if longer term returns have been driven by improving fundamentals.
See our latest analysis for Masi Agricola
In his essay The Superinvestors of Graham-and-Doddsville Warren Buffett described how share prices do not always rationally reflect the value of a business. One imperfect but simple way to consider how the market perception of a company has shifted is to compare the change in the earnings per share (EPS) with the share price movement.
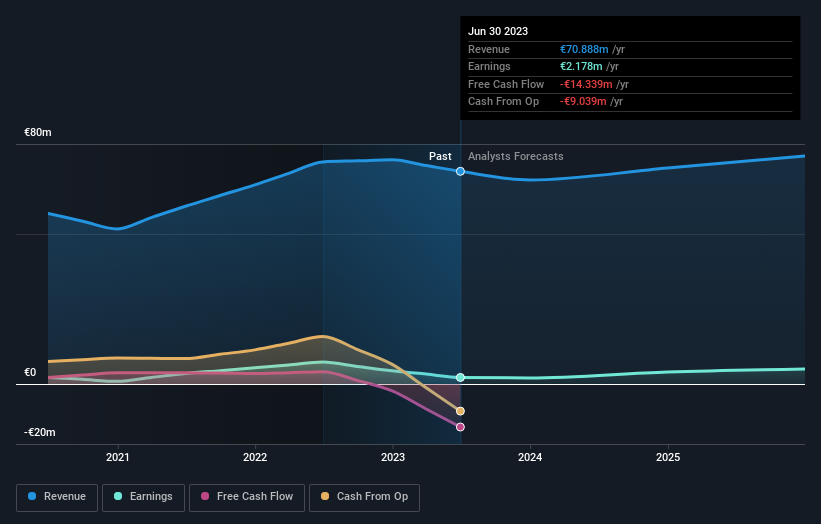
Over the last three years, Masi Agricola failed to grow earnings per share, which fell 0.5% (annualized).
Companies are not always focussed on EPS growth in the short term, and looking at how the share price has reacted, we don't think EPS is the most important metric for Masi Agricola at the moment. Since the change in EPS doesn't seem to correlate with the change in share price, it's worth taking a look at other metrics.
Languishing at just 1.1%, we doubt the dividend is doing much to prop up the share price. It could be that the revenue growth of 12% per year is viewed as evidence that Masi Agricola is growing. If the company is being managed for the long term good, today's shareholders might be right to hold on.
The image below shows how earnings and revenue have tracked over time (if you click on the image you can see greater detail).
Take a more thorough look at Masi Agricola's financial health with this free report on its balance sheet.
What About Dividends?
When looking at investment returns, it is important to consider the difference between total shareholder return (TSR) and share price return. The TSR is a return calculation that accounts for the value of cash dividends (assuming that any dividend received was reinvested) and the calculated value of any discounted capital raisings and spin-offs. Arguably, the TSR gives a more comprehensive picture of the return generated by a stock. We note that for Masi Agricola the TSR over the last 3 years was 103%, which is better than the share price return mentioned above. The dividends paid by the company have thusly boosted the total shareholder return.
A Different Perspective
We're pleased to report that Masi Agricola shareholders have received a total shareholder return of 20% over one year. Of course, that includes the dividend. Since the one-year TSR is better than the five-year TSR (the latter coming in at 9% per year), it would seem that the stock's performance has improved in recent times. Given the share price momentum remains strong, it might be worth taking a closer look at the stock, lest you miss an opportunity. It's always interesting to track share price performance over the longer term. But to understand Masi Agricola better, we need to consider many other factors. Even so, be aware that Masi Agricola is showing 2 warning signs in our investment analysis , you should know about...
But note: Masi Agricola may not be the best stock to buy. So take a peek at this free list of interesting companies with past earnings growth (and further growth forecast).
Please note, the market returns quoted in this article reflect the market weighted average returns of stocks that currently trade on Italian exchanges.
New: Manage All Your Stock Portfolios in One Place
We've created the ultimate portfolio companion for stock investors, and it's free.
• Connect an unlimited number of Portfolios and see your total in one currency
• Be alerted to new Warning Signs or Risks via email or mobile
• Track the Fair Value of your stocks
Have feedback on this article? Concerned about the content? Get in touch with us directly. Alternatively, email editorial-team (at) simplywallst.com.
This article by Simply Wall St is general in nature. We provide commentary based on historical data and analyst forecasts only using an unbiased methodology and our articles are not intended to be financial advice. It does not constitute a recommendation to buy or sell any stock, and does not take account of your objectives, or your financial situation. We aim to bring you long-term focused analysis driven by fundamental data. Note that our analysis may not factor in the latest price-sensitive company announcements or qualitative material. Simply Wall St has no position in any stocks mentioned.
About BIT:MASI
Masi Agricola
Produces and distributes wines in Italy, rest of Europe, the Americas, and internationally.
Reasonable growth potential with mediocre balance sheet.
Similar Companies
Market Insights

Community Narratives


