Advertisement
- Italy
- /
- Oil and Gas
- /
- BIT:ENI
Evaluating Eni Shares After Their 54% Climb and Recent LNG Expansion News

Simply Wall St
Reviewed by Bailey Pemberton
If you are considering what to do with Eni stock, you are definitely not alone. Many investors are sizing up their next move after seeing some intriguing changes in the company’s share price. Over just the last three years, shares have climbed an impressive 54.3%, and if you zoom out to five years, that figure rockets to nearly 199%. Even year to date, Eni sits on a healthy 10.7% gain, despite a slight dip of 2.9% this past week. These numbers highlight not only the potential for growth, but also suggest the market’s perception of risk and reward could be shifting as global energy markets evolve.
Looking beyond the charts, Eni currently holds a valuation score of 2 out of 6, reflecting that the company is undervalued by two of the six key accounting and market valuation checks we use. That score gives us a clue, but it only scratches the surface of understanding whether Eni is truly a bargain at today’s prices.
So, how does this valuation score really stack up? Let’s walk through the major valuation techniques for Eni, and at the end consider a more insightful way to think about what the stock is truly worth.
Eni scores just 2/6 on our valuation checks. See what other red flags we found in the full valuation breakdown.
Approach 1: Eni Discounted Cash Flow (DCF) Analysis
The Discounted Cash Flow (DCF) model estimates what a company is truly worth based on its ability to generate future cash flows. This approach projects Eni’s expected free cash flows over several years and then discounts those future cash flows back to their value in today’s euros, helping investors see whether the current stock price aligns with its real potential.
For Eni, the latest twelve months of free cash flow came in at approximately €4.77 billion. Analysts expect this figure to gradually rise, and Simply Wall St extrapolates these projections beyond the next five years with moderate growth. By 2028, free cash flow is expected to reach about €4.99 billion, and by 2035, extrapolated estimates point to around €6 billion.
Based on this analysis, Eni’s estimated fair value per share is €20.05. Currently, the market is pricing Eni at a level that is about 25.7% below this calculated worth, suggesting the stock is considerably undervalued according to the DCF approach. This gap between fair value and share price indicates meaningful upside potential if the forecasts prove accurate.
Result: UNDERVALUED
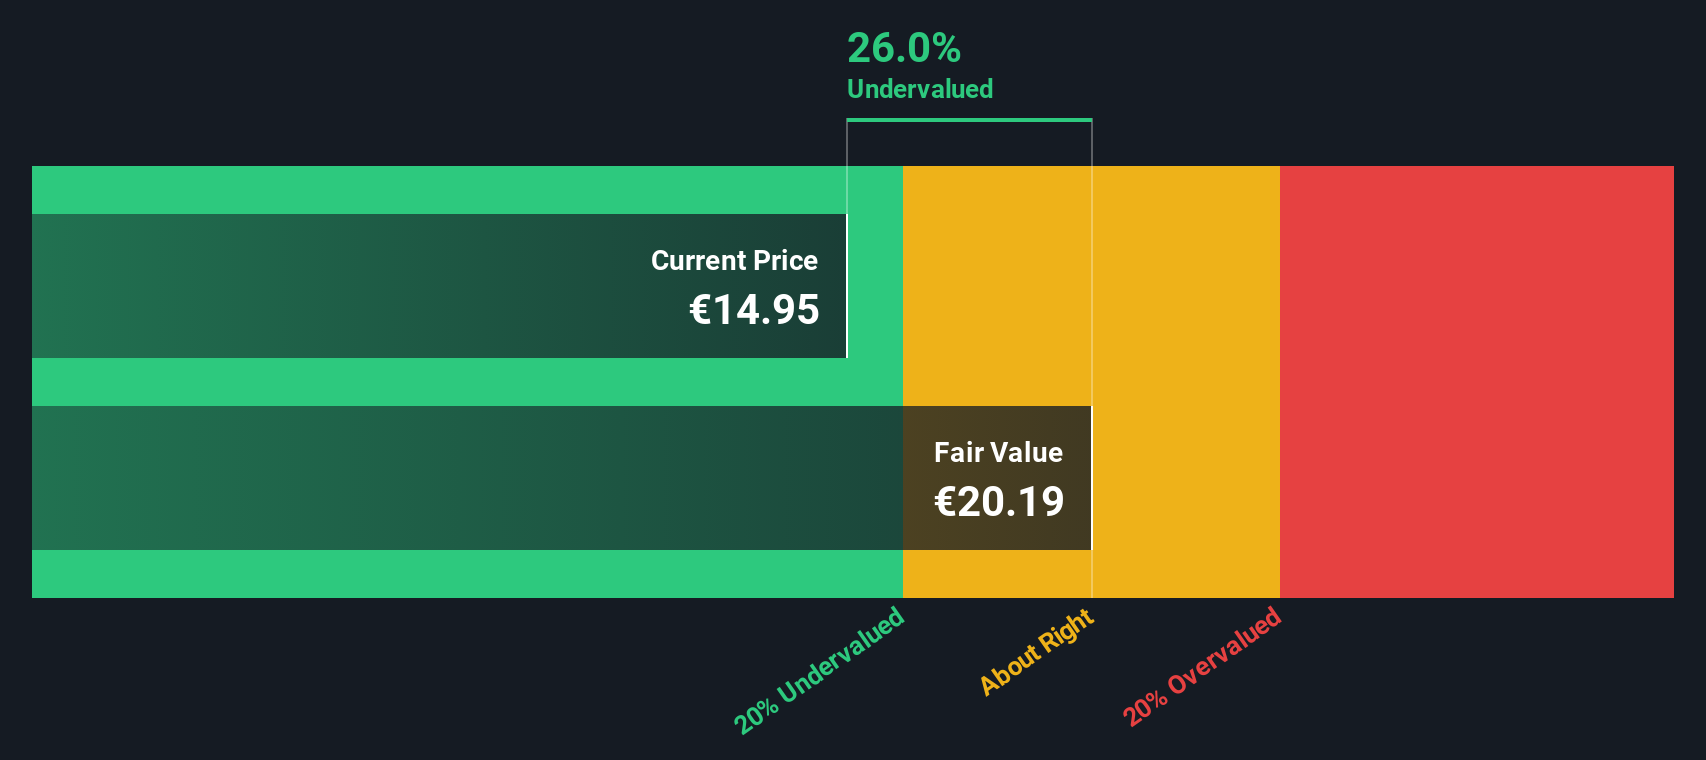
Our Discounted Cash Flow (DCF) analysis suggests Eni is undervalued by 25.7%. Track this in your watchlist or portfolio, or discover more undervalued stocks.
Approach 2: Eni Price vs Earnings (PE Ratio)
The Price-to-Earnings (PE) ratio is a go-to valuation metric for profitable companies like Eni, since it reflects what investors are willing to pay for each euro of earnings. For firms that consistently generate income, the PE ratio offers a straightforward lens into market sentiment and expectations for future performance.
However, it is important to remember that the “right” PE ratio varies depending on the company's growth outlook and the risk profile of its business. Higher growth prospects or lower perceived risks tend to justify a higher PE ratio, while greater risks or slowing growth can mean a lower fair value multiple.
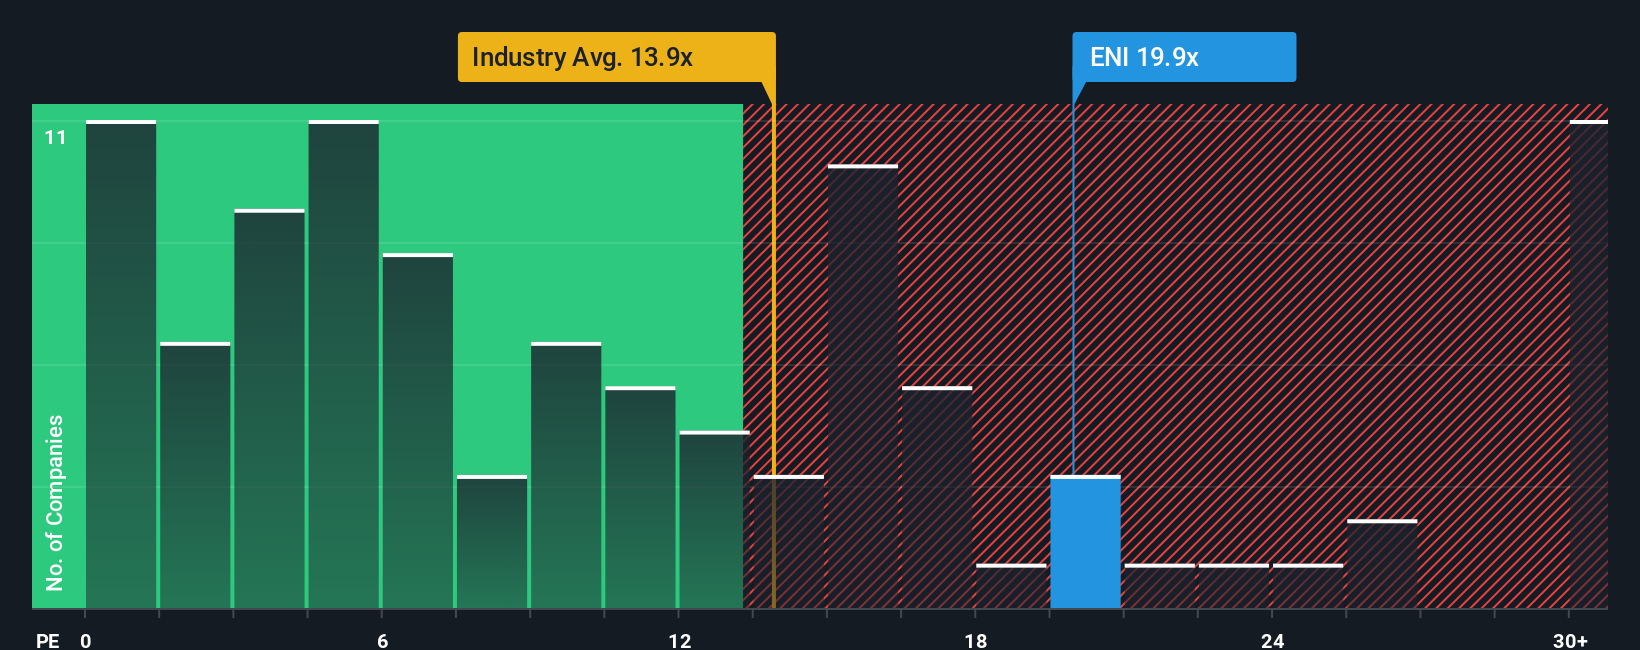
Eni currently trades at 19.9x earnings, well above the Oil and Gas industry average of 13.0x and also higher than the peer group average of 14.7x. At first glance, this premium may raise some eyebrows, but context matters. Simply Wall St's Fair Ratio, which factors in Eni’s specific earnings growth forecasts, its profit margins, industry trends, company size and risk, is calculated at 18.1x. This Fair Ratio offers a more tailored benchmark than a broad comparison to the sector or single competitors, since it reflects exactly what would be reasonable for Eni given its current fundamentals and outlook.
Comparing Eni’s actual PE ratio of 19.9x to the Fair Ratio of 18.1x suggests the stock is trading at a modest premium to its fair value, meaning the current market price may be factoring in higher expectations or lower risks than modeled.
Result: OVERVALUED
PE ratios tell one story, but what if the real opportunity lies elsewhere? Discover companies where insiders are betting big on explosive growth.
Upgrade Your Decision Making: Choose your Eni Narrative
Earlier we mentioned that there is an even better way to understand valuation, so let’s introduce you to Narratives. Narratives are simple, yet powerful stories that investors create to explain their perspective on a company, connecting their assumptions about fair value, future revenue, earnings, and margins with the underlying business story.
Rather than getting lost in complex numbers or static ratios, a Narrative guides you to link what’s happening inside Eni to a financial forecast and ultimately, a fair value. This means you can see why you believe Eni is a buy or sell, and exactly what needs to happen for your thesis to play out.
Narratives are quick to build and accessible right inside Simply Wall St’s Community page, where millions of investors share and compare their views. By presenting your assumptions transparently, you can check if the current price presents a good opportunity: if your fair value is above today’s price, it might be time to buy, and vice versa.
Importantly, Narratives update automatically as new news or earnings updates arrive, helping you react faster and stay aligned with the real story. For example, one Eni Narrative expects €17.5 per share based on a bullish LNG expansion and margin gains, while another expects €13.5 due to slow renewables and legacy losses. Both numbers are shaped by differing beliefs about the company’s future.
Do you think there's more to the story for Eni? Create your own Narrative to let the Community know!
This article by Simply Wall St is general in nature. We provide commentary based on historical data and analyst forecasts only using an unbiased methodology and our articles are not intended to be financial advice. It does not constitute a recommendation to buy or sell any stock, and does not take account of your objectives, or your financial situation. We aim to bring you long-term focused analysis driven by fundamental data. Note that our analysis may not factor in the latest price-sensitive company announcements or qualitative material. Simply Wall St has no position in any stocks mentioned.
Valuation is complex, but we're here to simplify it.
Discover if Eni might be undervalued or overvalued with our detailed analysis, featuring fair value estimates, potential risks, dividends, insider trades, and its financial condition.
Access Free AnalysisHave feedback on this article? Concerned about the content? Get in touch with us directly. Alternatively, email editorial-team@simplywallst.com
About BIT:ENI
Eni
Operates as an integrated energy company in Italy, Other European Union, Rest of Europe, the United States, Asia, Africa, and internationally.
Excellent balance sheet second-rate dividend payer.
Similar Companies
Market Insights

Advertisement
Community Narratives
A formidable player in AI and enterprise computing.
Fair Value US$210.00|12.2% overvalued
CO
Community Contributor
IREN's Bold Moves in Sustainable Bitcoin Mining & AI Data Centers
Fair Value US$72.52|17.1% undervalued
BL
Community Contributor
Cooling the Champions: The Aussie Tech Behind F1's Victories
Fair Value AU$12.40|38.7% undervalued
TR
Community Contributor