Advertisement
While some investors are already well versed in financial metrics (hat tip), this article is for those who would like to learn about Return On Equity (ROE) and why it is important. By way of learning-by-doing, we'll look at ROE to gain a better understanding of Pattern S.p.A. (BIT:PTR).
Return on equity or ROE is a key measure used to assess how efficiently a company's management is utilizing the company's capital. In short, ROE shows the profit each dollar generates with respect to its shareholder investments.
View our latest analysis for Pattern
How Is ROE Calculated?
The formula for return on equity is:
Return on Equity = Net Profit (from continuing operations) ÷ Shareholders' Equity
So, based on the above formula, the ROE for Pattern is:
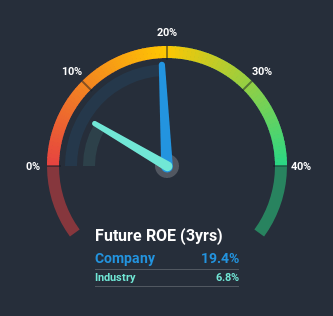
19% = €3.9m ÷ €20m (Based on the trailing twelve months to June 2020).
The 'return' is the amount earned after tax over the last twelve months. Another way to think of that is that for every €1 worth of equity, the company was able to earn €0.19 in profit.
Does Pattern Have A Good ROE?
Arguably the easiest way to assess company's ROE is to compare it with the average in its industry. However, this method is only useful as a rough check, because companies do differ quite a bit within the same industry classification. Pleasingly, Pattern has a superior ROE than the average (6.8%) in the Luxury industry.
That is a good sign. Bear in mind, a high ROE doesn't always mean superior financial performance. Aside from changes in net income, a high ROE can also be the outcome of high debt relative to equity, which indicates risk. To know the 3 risks we have identified for Pattern visit our risks dashboard for free.
The Importance Of Debt To Return On Equity
Most companies need money -- from somewhere -- to grow their profits. That cash can come from issuing shares, retained earnings, or debt. In the first and second cases, the ROE will reflect this use of cash for investment in the business. In the latter case, the debt used for growth will improve returns, but won't affect the total equity. In this manner the use of debt will boost ROE, even though the core economics of the business stay the same.
Pattern's Debt And Its 19% ROE
Pattern has a debt to equity ratio of 0.70, which is far from excessive. The fact that it achieved a fairly good ROE with only modest debt suggests the business might be worth putting on your watchlist. Conservative use of debt to boost returns is usually a good move for shareholders, though it does leave the company more exposed to interest rate rises.
Summary
Return on equity is useful for comparing the quality of different businesses. Companies that can achieve high returns on equity without too much debt are generally of good quality. If two companies have around the same level of debt to equity, and one has a higher ROE, I'd generally prefer the one with higher ROE.
Having said that, while ROE is a useful indicator of business quality, you'll have to look at a whole range of factors to determine the right price to buy a stock. The rate at which profits are likely to grow, relative to the expectations of profit growth reflected in the current price, must be considered, too. So I think it may be worth checking this free report on analyst forecasts for the company.
Of course Pattern may not be the best stock to buy. So you may wish to see this free collection of other companies that have high ROE and low debt.
When trading Pattern or any other investment, use the platform considered by many to be the Professional's Gateway to the Worlds Market, Interactive Brokers. You get the lowest-cost* trading on stocks, options, futures, forex, bonds and funds worldwide from a single integrated account. Promoted
New: Manage All Your Stock Portfolios in One Place
We've created the ultimate portfolio companion for stock investors, and it's free.
• Connect an unlimited number of Portfolios and see your total in one currency
• Be alerted to new Warning Signs or Risks via email or mobile
• Track the Fair Value of your stocks
This article by Simply Wall St is general in nature. It does not constitute a recommendation to buy or sell any stock, and does not take account of your objectives, or your financial situation. We aim to bring you long-term focused analysis driven by fundamental data. Note that our analysis may not factor in the latest price-sensitive company announcements or qualitative material. Simply Wall St has no position in any stocks mentioned.
*Interactive Brokers Rated Lowest Cost Broker by StockBrokers.com Annual Online Review 2020
Have feedback on this article? Concerned about the content? Get in touch with us directly. Alternatively, email editorial-team@simplywallst.com.
About BIT:PTR
Pattern
Engages in engineering, prototyping, and production of luxury goods in Italy, rest of the European Union, and internationally.
Very undervalued with moderate growth potential.
Market Insights


Advertisement
Weekly Picks
CE


Ceazar on Sparc AI ·
When GPS fails: this small cap is fixing a $54B drone problem
Fair Value:CA$5.2540.0% undervalued
83 followersusers have followed this narrative
0 commentsusers have commented on this narrative
21 likesusers have liked this narrative
HE


HedgeY on IonQ ·
The Best-Funded Quantum Platform and Still a Stock Priced for Perfection
Fair Value:US$482.3% overvalued
32 followersusers have followed this narrative
0 commentsusers have commented on this narrative
8 likesusers have liked this narrative
BL


BlackGoat on Cerebras Systems ·
The Wafer Giant Threatening NVIDIA's GPU Hegemony
Fair Value:US$415.5450.7% undervalued
54 followersusers have followed this narrative
1 commentusers have commented on this narrative
8 likesusers have liked this narrative
IV

Ivoed on Netflix ·
Netflix’s Business Quality Is Clear. The Harder Question Is Whether The Stock Is Still Cheap
Fair Value:US$825.3% undervalued
27 followersusers have followed this narrative
2 commentsusers have commented on this narrative
10 likesusers have liked this narrative
Recently Updated Narratives
SO

Solvent_Octopus_mwbl on CRDB Bank ·
Is the Market Underestimating CRDB?
Fair Value:TSh2.8k1.4% undervalued
1 followerusers have followed this narrative
0 commentsusers have commented on this narrative
0 likesusers have liked this narrative
CU

CubanEros on Microsoft ·
A wonderful business at reasonable price.
Fair Value:US$419.917.0% undervalued
4 followersusers have followed this narrative
0 commentsusers have commented on this narrative
0 likesusers have liked this narrative
DR


DrPotato on TeamViewer ·
TeamViewer Set to Evolve from Stagnation to Enterprise Growth by 2028
Fair Value:€13.3260.9% undervalued
5 followersusers have followed this narrative
0 commentsusers have commented on this narrative
0 likesusers have liked this narrative
Popular Narratives
IN


Investingwilly on Mastercard ·
Mastercard: The Best Dividend Stock You're Ignoring
Fair Value:US$75028.1% undervalued
82 followersusers have followed this narrative
1 commentusers have commented on this narrative
9 likesusers have liked this narrative
HA


HarishPK on Adobe ·
Adobe: A Probabilistic Case for Undervaluation
Fair Value:US$319.9631.3% undervalued
63 followersusers have followed this narrative
9 commentsusers have commented on this narrative
19 likesusers have liked this narrative
NI


niteco on Broadcom ·
A Capital Allocation Favorite with Structural Importance
Fair Value:US$651.0544.6% undervalued
56 followersusers have followed this narrative
0 commentsusers have commented on this narrative
13 likesusers have liked this narrative
Trending Discussion

PR


ProjectKai on Iovance Biotherapeutics ·
Polip, this is Kai. When do you estimate IOVA could reach a $12–20 billion valuation, implying rough...
0
|0
