Advertisement
How far off is Pattern S.p.A. (BIT:PTR) from its intrinsic value? Using the most recent financial data, we'll take a look at whether the stock is fairly priced by taking the expected future cash flows and discounting them to today's value. One way to achieve this is by employing the Discounted Cash Flow (DCF) model. Models like these may appear beyond the comprehension of a lay person, but they're fairly easy to follow.
We generally believe that a company's value is the present value of all of the cash it will generate in the future. However, a DCF is just one valuation metric among many, and it is not without flaws. Anyone interested in learning a bit more about intrinsic value should have a read of the Simply Wall St analysis model.
See our latest analysis for Pattern
The model
We are going to use a two-stage DCF model, which, as the name states, takes into account two stages of growth. The first stage is generally a higher growth period which levels off heading towards the terminal value, captured in the second 'steady growth' period. In the first stage we need to estimate the cash flows to the business over the next ten years. Where possible we use analyst estimates, but when these aren't available we extrapolate the previous free cash flow (FCF) from the last estimate or reported value. We assume companies with shrinking free cash flow will slow their rate of shrinkage, and that companies with growing free cash flow will see their growth rate slow, over this period. We do this to reflect that growth tends to slow more in the early years than it does in later years.
Generally we assume that a dollar today is more valuable than a dollar in the future, so we discount the value of these future cash flows to their estimated value in today's dollars:
10-year free cash flow (FCF) estimate
| 2022 | 2023 | 2024 | 2025 | 2026 | 2027 | 2028 | 2029 | 2030 | 2031 | |
| Levered FCF (€, Millions) | €5.15m | €6.05m | €6.35m | €6.60m | €6.82m | €7.01m | €7.19m | €7.36m | €7.51m | €7.66m |
| Growth Rate Estimate Source | Analyst x2 | Analyst x2 | Est @ 4.94% | Est @ 3.98% | Est @ 3.31% | Est @ 2.84% | Est @ 2.52% | Est @ 2.29% | Est @ 2.13% | Est @ 2.01% |
| Present Value (€, Millions) Discounted @ 8.7% | €4.7 | €5.1 | €4.9 | €4.7 | €4.5 | €4.2 | €4.0 | €3.8 | €3.5 | €3.3 |
("Est" = FCF growth rate estimated by Simply Wall St)
Present Value of 10-year Cash Flow (PVCF) = €42m
After calculating the present value of future cash flows in the initial 10-year period, we need to calculate the Terminal Value, which accounts for all future cash flows beyond the first stage. For a number of reasons a very conservative growth rate is used that cannot exceed that of a country's GDP growth. In this case we have used the 5-year average of the 10-year government bond yield (1.8%) to estimate future growth. In the same way as with the 10-year 'growth' period, we discount future cash flows to today's value, using a cost of equity of 8.7%.
Terminal Value (TV)= FCF2031 × (1 + g) ÷ (r – g) = €7.7m× (1 + 1.8%) ÷ (8.7%– 1.8%) = €112m
Present Value of Terminal Value (PVTV)= TV / (1 + r)10= €112m÷ ( 1 + 8.7%)10= €48m
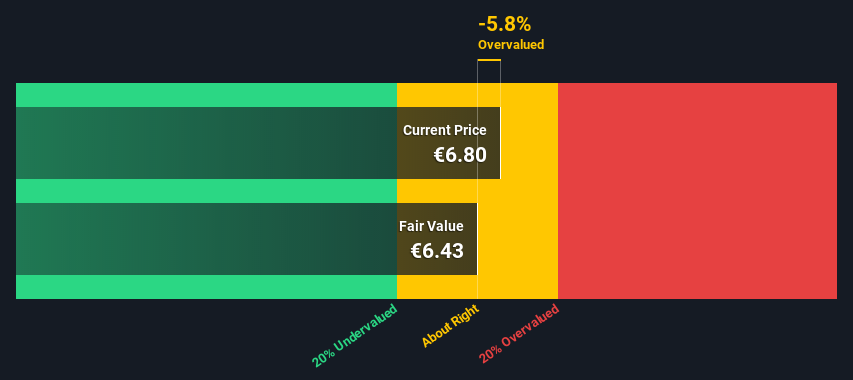
The total value, or equity value, is then the sum of the present value of the future cash flows, which in this case is €90m. To get the intrinsic value per share, we divide this by the total number of shares outstanding. Relative to the current share price of €6.8, the company appears around fair value at the time of writing. Remember though, that this is just an approximate valuation, and like any complex formula - garbage in, garbage out.
Important assumptions
The calculation above is very dependent on two assumptions. The first is the discount rate and the other is the cash flows. Part of investing is coming up with your own evaluation of a company's future performance, so try the calculation yourself and check your own assumptions. The DCF also does not consider the possible cyclicality of an industry, or a company's future capital requirements, so it does not give a full picture of a company's potential performance. Given that we are looking at Pattern as potential shareholders, the cost of equity is used as the discount rate, rather than the cost of capital (or weighted average cost of capital, WACC) which accounts for debt. In this calculation we've used 8.7%, which is based on a levered beta of 1.119. Beta is a measure of a stock's volatility, compared to the market as a whole. We get our beta from the industry average beta of globally comparable companies, with an imposed limit between 0.8 and 2.0, which is a reasonable range for a stable business.
Looking Ahead:
Whilst important, the DCF calculation shouldn't be the only metric you look at when researching a company. The DCF model is not a perfect stock valuation tool. Instead the best use for a DCF model is to test certain assumptions and theories to see if they would lead to the company being undervalued or overvalued. For instance, if the terminal value growth rate is adjusted slightly, it can dramatically alter the overall result. For Pattern, there are three relevant elements you should consider:
- Risks: For instance, we've identified 3 warning signs for Pattern that you should be aware of.
- Future Earnings: How does PTR's growth rate compare to its peers and the wider market? Dig deeper into the analyst consensus number for the upcoming years by interacting with our free analyst growth expectation chart.
- Other High Quality Alternatives: Do you like a good all-rounder? Explore our interactive list of high quality stocks to get an idea of what else is out there you may be missing!
PS. The Simply Wall St app conducts a discounted cash flow valuation for every stock on the BIT every day. If you want to find the calculation for other stocks just search here.
New: Manage All Your Stock Portfolios in One Place
We've created the ultimate portfolio companion for stock investors, and it's free.
• Connect an unlimited number of Portfolios and see your total in one currency
• Be alerted to new Warning Signs or Risks via email or mobile
• Track the Fair Value of your stocks
Have feedback on this article? Concerned about the content? Get in touch with us directly. Alternatively, email editorial-team (at) simplywallst.com.
This article by Simply Wall St is general in nature. We provide commentary based on historical data and analyst forecasts only using an unbiased methodology and our articles are not intended to be financial advice. It does not constitute a recommendation to buy or sell any stock, and does not take account of your objectives, or your financial situation. We aim to bring you long-term focused analysis driven by fundamental data. Note that our analysis may not factor in the latest price-sensitive company announcements or qualitative material. Simply Wall St has no position in any stocks mentioned.
About BIT:PTR
Pattern
Engages in engineering, prototyping, and production of luxury goods in Italy, rest of the European Union, and internationally.
Very undervalued with moderate growth potential.
Market Insights


Advertisement
Weekly Picks
LO


Lou_Basenese on Cue Biopharma ·
Cue Biopharma (NASDAQ: CUE): The Scientist Behind Xolair Just Gave Cue a Next-Generation Shot at the Same Multi-Billion-Dollar Market
Fair Value:US$7058.5% undervalued
21 followersusers have followed this narrative
0 commentsusers have commented on this narrative
5 likesusers have liked this narrative
HE


HedgeY on AST SpaceMobile ·
AST SpaceMobile: The Boldest Direct-to-Cell Bet in Public Markets
Fair Value:US$17045.8% undervalued
43 followersusers have followed this narrative
0 commentsusers have commented on this narrative
13 likesusers have liked this narrative
FU

FundamentalFlow on Onto Innovation ·
Onto Innovation: The Advanced Packaging Chokepoint 51.3% undervalued intrinsic discount
Fair Value:US$38029.2% undervalued
26 followersusers have followed this narrative
0 commentsusers have commented on this narrative
8 likesusers have liked this narrative
MA


martinarauz on Nu Holdings ·
Investment Analysis (May 2026)
Fair Value:US$22.7449.0% undervalued
58 followersusers have followed this narrative
0 commentsusers have commented on this narrative
15 likesusers have liked this narrative
Recently Updated Narratives
RE

REElax on Volta Metals ·
Springer REE deposit valuation
Fair Value:CA$3.595.0% undervalued
6 followersusers have followed this narrative
0 commentsusers have commented on this narrative
0 likesusers have liked this narrative
DA


davidlsander on Atlas Salt ·
Once In A Life Time Deeply Discounted Recession Proof Utility
Fair Value:CA$2.9656.8% undervalued
1 followerusers have followed this narrative
0 commentsusers have commented on this narrative
0 likesusers have liked this narrative
PI


PittTheYounger on SSAB ·
SSAB in pole position when it comes to the combination of steel tariffs and the EU's investment drive
Fair Value:SEK 79.1721.8% overvalued
63 followersusers have followed this narrative
3 commentsusers have commented on this narrative
0 likesusers have liked this narrative
Popular Narratives
MA
martinarauz on Nu Holdings ·
Investment Analysis (May 2026)
Fair Value:US$22.7449.0% undervalued
58 followersusers have followed this narrative
0 commentsusers have commented on this narrative
15 likesusers have liked this narrative
CL


Clive_Thompson on Take-Two Interactive Software ·
Take-Two Interactive: The Calm Before the Storm NASDAQ: TTWO Last Price: $242.41 Date: May 15, 2026
Fair Value:US$276.9723.3% undervalued
57 followersusers have followed this narrative
0 commentsusers have commented on this narrative
14 likesusers have liked this narrative
NI


niteco on Honeywell International ·
Honeywell - The Demand-Side of the AI Infrastructure
Fair Value:US$320.1933.9% undervalued
48 followersusers have followed this narrative
0 commentsusers have commented on this narrative
19 likesusers have liked this narrative
Trending Discussion
KA


Karndog on Berkshire Hathaway ·
Abel is also an Energy expert. He's already on the AI train even without "buying tech".
0
|0
SI

Simply Wall St User on Automatic Data Processing ·
This stock with dividend Aristocrat status and real annual increases may require more time to ascert...
0
|0
SI

Simply Wall St User on Access Holdings ·
It's wonderful. It has greatly helped me take informed decisions.
0
|0