How Does OVS's (BIT:OVS) P/E Compare To Its Industry, After Its Big Share Price Gain?


OVS (BIT:OVS) shareholders are no doubt pleased to see that the share price has had a great month, posting a 37% gain, recovering from prior weakness. But shareholders may not all be feeling jubilant, since the share price is still down 32% in the last year.
All else being equal, a sharp share price increase should make a stock less attractive to potential investors. In the long term, share prices tend to follow earnings per share, but in the short term prices bounce around in response to short term factors (which are not always obvious). The implication here is that deep value investors might steer clear when expectations of a company are too high. One way to gauge market expectations of a stock is to look at its Price to Earnings Ratio (PE Ratio). A high P/E ratio means that investors have a high expectation about future growth, while a low P/E ratio means they have low expectations about future growth.
Check out our latest analysis for OVS
How Does OVS's P/E Ratio Compare To Its Peers?
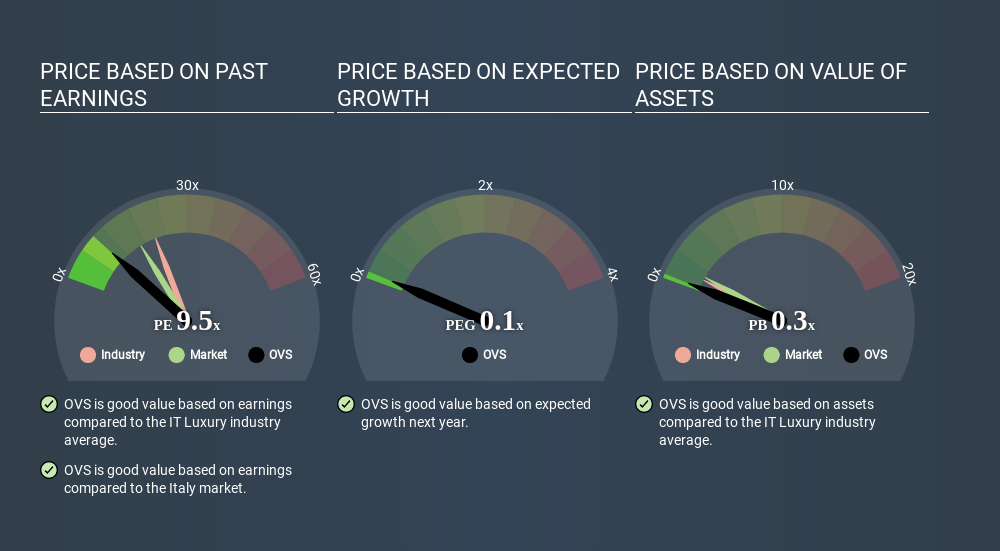
We can tell from its P/E ratio of 9.53 that sentiment around OVS isn't particularly high. If you look at the image below, you can see OVS has a lower P/E than the average (21.5) in the luxury industry classification.
Its relatively low P/E ratio indicates that OVS shareholders think it will struggle to do as well as other companies in its industry classification. While current expectations are low, the stock could be undervalued if the situation is better than the market assumes. You should delve deeper. I like to check if company insiders have been buying or selling.
How Growth Rates Impact P/E Ratios
Companies that shrink earnings per share quickly will rapidly decrease the 'E' in the equation. That means unless the share price falls, the P/E will increase in a few years. A higher P/E should indicate the stock is expensive relative to others -- and that may encourage shareholders to sell.
OVS's earnings per share fell by 2.0% in the last twelve months. And EPS is down 31% a year, over the last 3 years. So we might expect a relatively low P/E.
Remember: P/E Ratios Don't Consider The Balance Sheet
Don't forget that the P/E ratio considers market capitalization. So it won't reflect the advantage of cash, or disadvantage of debt. Theoretically, a business can improve its earnings (and produce a lower P/E in the future) by investing in growth. That means taking on debt (or spending its cash).
Such spending might be good or bad, overall, but the key point here is that you need to look at debt to understand the P/E ratio in context.
OVS's Balance Sheet
Net debt totals a substantial 100% of OVS's market cap. This is a relatively high level of debt, so the stock probably deserves a relatively low P/E ratio. Keep that in mind when comparing it to other companies.
The Verdict On OVS's P/E Ratio
OVS's P/E is 9.5 which is below average (16.6) in the IT market. The P/E reflects market pessimism that probably arises from the lack of recent EPS growth, paired with significant leverage. What is very clear is that the market has become less pessimistic about OVS over the last month, with the P/E ratio rising from 6.9 back then to 9.5 today. For those who like to invest in turnarounds, that might mean it's time to put the stock on a watchlist, or research it. But others might consider the opportunity to have passed.
When the market is wrong about a stock, it gives savvy investors an opportunity. As value investor Benjamin Graham famously said, 'In the short run, the market is a voting machine but in the long run, it is a weighing machine. So this free visual report on analyst forecasts could hold the key to an excellent investment decision.
But note: OVS may not be the best stock to buy. So take a peek at this free list of interesting companies with strong recent earnings growth (and a P/E ratio below 20).
Love or hate this article? Concerned about the content? Get in touch with us directly. Alternatively, email editorial-team@simplywallst.com.
This article by Simply Wall St is general in nature. It does not constitute a recommendation to buy or sell any stock, and does not take account of your objectives, or your financial situation. We aim to bring you long-term focused analysis driven by fundamental data. Note that our analysis may not factor in the latest price-sensitive company announcements or qualitative material. Simply Wall St has no position in any stocks mentioned. Thank you for reading.
About BIT:OVS
Adequate balance sheet and fair value.
Market Insights

Community Narratives

