Further weakness as Geox (BIT:GEO) drops 12% this week, taking five-year losses to 50%

We think intelligent long term investing is the way to go. But no-one is immune from buying too high. To wit, the Geox S.p.A. (BIT:GEO) share price managed to fall 51% over five long years. That is extremely sub-optimal, to say the least. We also note that the stock has performed poorly over the last year, with the share price down 35%. On top of that, the share price is down 12% in the last week.
With the stock having lost 12% in the past week, it's worth taking a look at business performance and seeing if there's any red flags.
Check out our latest analysis for Geox
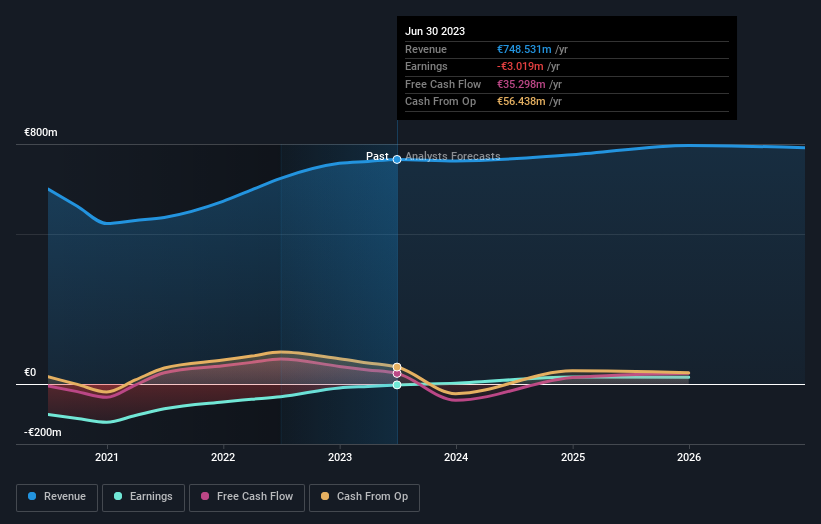
Because Geox made a loss in the last twelve months, we think the market is probably more focussed on revenue and revenue growth, at least for now. Generally speaking, companies without profits are expected to grow revenue every year, and at a good clip. Some companies are willing to postpone profitability to grow revenue faster, but in that case one does expect good top-line growth.
Over half a decade Geox reduced its trailing twelve month revenue by 4.8% for each year. That's not what investors generally want to see. With neither profit nor revenue growth, the loss of 9% per year doesn't really surprise us. We don't think anyone is rushing to buy this stock. Not that many investors like to invest in companies that are losing money and not growing revenue.
You can see how earnings and revenue have changed over time in the image below (click on the chart to see the exact values).

You can see how its balance sheet has strengthened (or weakened) over time in this free interactive graphic.
A Different Perspective
Geox shareholders are down 35% for the year, but the market itself is up 16%. However, keep in mind that even the best stocks will sometimes underperform the market over a twelve month period. Unfortunately, last year's performance may indicate unresolved challenges, given that it was worse than the annualised loss of 8% over the last half decade. Generally speaking long term share price weakness can be a bad sign, though contrarian investors might want to research the stock in hope of a turnaround. Shareholders might want to examine this detailed historical graph of past earnings, revenue and cash flow.
If you are like me, then you will not want to miss this free list of growing companies that insiders are buying.
Please note, the market returns quoted in this article reflect the market weighted average returns of stocks that currently trade on Italian exchanges.
New: Manage All Your Stock Portfolios in One Place
We've created the ultimate portfolio companion for stock investors, and it's free.
• Connect an unlimited number of Portfolios and see your total in one currency
• Be alerted to new Warning Signs or Risks via email or mobile
• Track the Fair Value of your stocks
Have feedback on this article? Concerned about the content? Get in touch with us directly. Alternatively, email editorial-team (at) simplywallst.com.
This article by Simply Wall St is general in nature. We provide commentary based on historical data and analyst forecasts only using an unbiased methodology and our articles are not intended to be financial advice. It does not constitute a recommendation to buy or sell any stock, and does not take account of your objectives, or your financial situation. We aim to bring you long-term focused analysis driven by fundamental data. Note that our analysis may not factor in the latest price-sensitive company announcements or qualitative material. Simply Wall St has no position in any stocks mentioned.
About BIT:GEO
Geox
Geox S.p.A. creates, produces, promotes, and distributes footwear and apparel to retailers and end consumers in Italy, Europe, North America, and internationally.
Adequate balance sheet and fair value.


