
Advertisement
COVER 50 S.p.A.'s (BIT:COV) Dismal Stock Performance Reflects Weak Fundamentals

It is hard to get excited after looking at COVER 50's (BIT:COV) recent performance, when its stock has declined 15% over the past three months. We decided to study the company's financials to determine if the downtrend will continue as the long-term performance of a company usually dictates market outcomes. Particularly, we will be paying attention to COVER 50's ROE today.
Return on equity or ROE is a key measure used to assess how efficiently a company's management is utilizing the company's capital. In simpler terms, it measures the profitability of a company in relation to shareholder's equity.
Check out our latest analysis for COVER 50
How Is ROE Calculated?
The formula for return on equity is:
Return on Equity = Net Profit (from continuing operations) ÷ Shareholders' Equity
So, based on the above formula, the ROE for COVER 50 is:
6.2% = €1.6m ÷ €26m (Based on the trailing twelve months to June 2020).
The 'return' is the yearly profit. That means that for every €1 worth of shareholders' equity, the company generated €0.06 in profit.
Why Is ROE Important For Earnings Growth?
Thus far, we have learned that ROE measures how efficiently a company is generating its profits. Based on how much of its profits the company chooses to reinvest or "retain", we are then able to evaluate a company's future ability to generate profits. Generally speaking, other things being equal, firms with a high return on equity and profit retention, have a higher growth rate than firms that don’t share these attributes.
COVER 50's Earnings Growth And 6.2% ROE
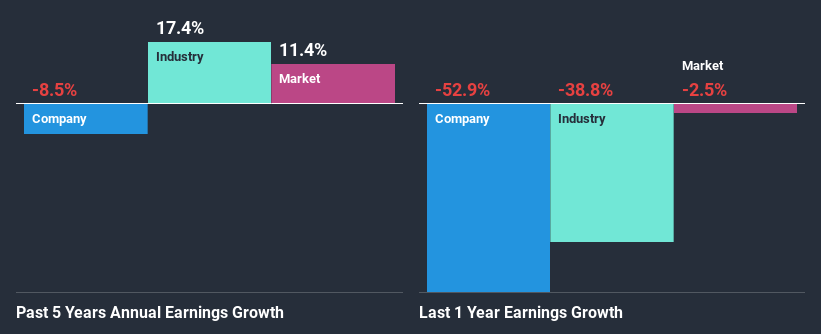
When you first look at it, COVER 50's ROE doesn't look that attractive. Yet, a closer study shows that the company's ROE is similar to the industry average of 6.8%. But COVER 50 saw a five year net income decline of 8.5% over the past five years. Bear in mind, the company does have a slightly low ROE. Hence, this goes some way in explaining the shrinking earnings.
However, when we compared COVER 50's growth with the industry we found that while the company's earnings have been shrinking, the industry has seen an earnings growth of 17% in the same period. This is quite worrisome.
The basis for attaching value to a company is, to a great extent, tied to its earnings growth. It’s important for an investor to know whether the market has priced in the company's expected earnings growth (or decline). This then helps them determine if the stock is placed for a bright or bleak future. One good indicator of expected earnings growth is the P/E ratio which determines the price the market is willing to pay for a stock based on its earnings prospects. So, you may want to check if COVER 50 is trading on a high P/E or a low P/E, relative to its industry.
Is COVER 50 Making Efficient Use Of Its Profits?
While the company did payout a portion of its dividend in the past, it currently doesn't pay a dividend. This implies that potentially all of its profits are being reinvested in the business.
Conclusion
In total, we would have a hard think before deciding on any investment action concerning COVER 50. Because the company is not reinvesting much into the business, and given the low ROE, it's not surprising to see the lack or absence of growth in its earnings. So far, we've only made a quick discussion around the company's earnings growth. You can do your own research on COVER 50 and see how it has performed in the past by looking at this FREE detailed graph of past earnings, revenue and cash flows.
If you decide to trade COVER 50, use the lowest-cost* platform that is rated #1 Overall by Barron’s, Interactive Brokers. Trade stocks, options, futures, forex, bonds and funds on 135 markets, all from a single integrated account. Promoted
New: AI Stock Screener & Alerts
Our new AI Stock Screener scans the market every day to uncover opportunities.
• Dividend Powerhouses (3%+ Yield)
• Undervalued Small Caps with Insider Buying
• High growth Tech and AI Companies
Or build your own from over 50 metrics.
This article by Simply Wall St is general in nature. It does not constitute a recommendation to buy or sell any stock, and does not take account of your objectives, or your financial situation. We aim to bring you long-term focused analysis driven by fundamental data. Note that our analysis may not factor in the latest price-sensitive company announcements or qualitative material. Simply Wall St has no position in any stocks mentioned.
*Interactive Brokers Rated Lowest Cost Broker by StockBrokers.com Annual Online Review 2020
Have feedback on this article? Concerned about the content? Get in touch with us directly. Alternatively, email editorial-team@simplywallst.com.
About BIT:CVR50
COVER 50
COVER 50 S.p.A. engages in the creation, production, and marketing of denim and trousers in Italy and internationally.
Excellent balance sheet with proven track record.
Market Insights

Advertisement
Community Narratives
Groundbreaking therapies that could change the treatment landscape for PTSD, fibromyalgia, MS & Alzheimer’s
Fair Value US$6.20|86.9% undervalued
CM
Community Contributor
DigitalOcean Will Grow 14% by Embracing AI with Paperspace Acquisition
Fair Value US$50.00|41.7% undervalued
NE
Community Contributor
Viant Technology: A Rising AdTech Challenger in the AI-Powered CTV Market
Fair Value US$38.61|63.2% undervalued
BL
Community Contributor
Volvo will Accelerate Forward into Electric and Autonomous Leadership in Five Years
Fair Value SEK 438.80|39.7% undervalued
UN
Community Contributor