Interpump Group S.p.A.'s (BIT:IP) Recent Stock Performance Looks Decent- Can Strong Fundamentals Be the Reason?


Interpump Group's (BIT:IP) stock up by 9.5% over the past three months. Given its impressive performance, we decided to study the company's key financial indicators as a company's long-term fundamentals usually dictate market outcomes. Specifically, we decided to study Interpump Group's ROE in this article.
ROE or return on equity is a useful tool to assess how effectively a company can generate returns on the investment it received from its shareholders. In simpler terms, it measures the profitability of a company in relation to shareholder's equity.
See our latest analysis for Interpump Group
How Is ROE Calculated?
ROE can be calculated by using the formula:
Return on Equity = Net Profit (from continuing operations) ÷ Shareholders' Equity
So, based on the above formula, the ROE for Interpump Group is:
17% = €296m ÷ €1.8b (Based on the trailing twelve months to September 2023).
The 'return' is the income the business earned over the last year. That means that for every €1 worth of shareholders' equity, the company generated €0.17 in profit.
What Is The Relationship Between ROE And Earnings Growth?
We have already established that ROE serves as an efficient profit-generating gauge for a company's future earnings. Based on how much of its profits the company chooses to reinvest or "retain", we are then able to evaluate a company's future ability to generate profits. Assuming all else is equal, companies that have both a higher return on equity and higher profit retention are usually the ones that have a higher growth rate when compared to companies that don't have the same features.
Interpump Group's Earnings Growth And 17% ROE
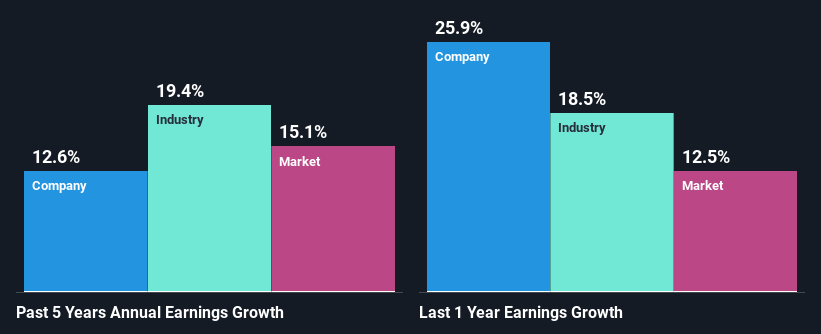
To start with, Interpump Group's ROE looks acceptable. Especially when compared to the industry average of 13% the company's ROE looks pretty impressive. This certainly adds some context to Interpump Group's decent 13% net income growth seen over the past five years.
Next, on comparing with the industry net income growth, we found that Interpump Group's reported growth was lower than the industry growth of 19% over the last few years, which is not something we like to see.
The basis for attaching value to a company is, to a great extent, tied to its earnings growth. What investors need to determine next is if the expected earnings growth, or the lack of it, is already built into the share price. This then helps them determine if the stock is placed for a bright or bleak future. One good indicator of expected earnings growth is the P/E ratio which determines the price the market is willing to pay for a stock based on its earnings prospects. So, you may want to check if Interpump Group is trading on a high P/E or a low P/E, relative to its industry.
Is Interpump Group Making Efficient Use Of Its Profits?
Interpump Group has a low three-year median payout ratio of 13%, meaning that the company retains the remaining 87% of its profits. This suggests that the management is reinvesting most of the profits to grow the business.
Moreover, Interpump Group is determined to keep sharing its profits with shareholders which we infer from its long history of paying a dividend for at least ten years. Upon studying the latest analysts' consensus data, we found that the company is expected to keep paying out approximately 14% of its profits over the next three years. As a result, Interpump Group's ROE is not expected to change by much either, which we inferred from the analyst estimate of 15% for future ROE.
Summary
Overall, we are quite pleased with Interpump Group's performance. In particular, it's great to see that the company is investing heavily into its business and along with a high rate of return, that has resulted in a respectable growth in its earnings. Having said that, the company's earnings growth is expected to slow down, as forecasted in the current analyst estimates. To know more about the latest analysts predictions for the company, check out this visualization of analyst forecasts for the company.
New: AI Stock Screener & Alerts
Our new AI Stock Screener scans the market every day to uncover opportunities.
• Dividend Powerhouses (3%+ Yield)
• Undervalued Small Caps with Insider Buying
• High growth Tech and AI Companies
Or build your own from over 50 metrics.
Have feedback on this article? Concerned about the content? Get in touch with us directly. Alternatively, email editorial-team (at) simplywallst.com.
This article by Simply Wall St is general in nature. We provide commentary based on historical data and analyst forecasts only using an unbiased methodology and our articles are not intended to be financial advice. It does not constitute a recommendation to buy or sell any stock, and does not take account of your objectives, or your financial situation. We aim to bring you long-term focused analysis driven by fundamental data. Note that our analysis may not factor in the latest price-sensitive company announcements or qualitative material. Simply Wall St has no position in any stocks mentioned.
About BIT:IP
Interpump Group
Engages in the manufacturing and selling of high-pressure pumps in Italy, Europe, North America, Pacific area, and internationally.
Flawless balance sheet with moderate growth potential.

