

What are the early trends we should look for to identify a stock that could multiply in value over the long term? Firstly, we'll want to see a proven return on capital employed (ROCE) that is increasing, and secondly, an expanding base of capital employed. This shows us that it's a compounding machine, able to continually reinvest its earnings back into the business and generate higher returns. That's why when we briefly looked at India's (NSE:PTC) ROCE trend, we were pretty happy with what we saw.
Return On Capital Employed (ROCE): What is it?
For those that aren't sure what ROCE is, it measures the amount of pre-tax profits a company can generate from the capital employed in its business. Analysts use this formula to calculate it for India:
Return on Capital Employed = Earnings Before Interest and Tax (EBIT) ÷ (Total Assets - Current Liabilities)
0.14 = ₹18b ÷ (₹230b - ₹97b) (Based on the trailing twelve months to September 2020).
Therefore, India has an ROCE of 14%. On its own, that's a standard return, however it's much better than the 6.7% generated by the Renewable Energy industry.
See our latest analysis for India
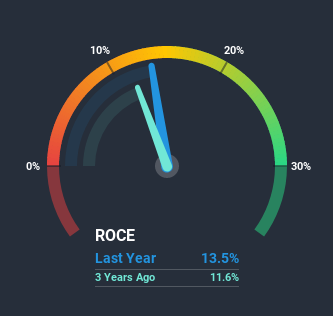
While the past is not representative of the future, it can be helpful to know how a company has performed historically, which is why we have this chart above. If you're interested in investigating India's past further, check out this free graph of past earnings, revenue and cash flow.
What The Trend Of ROCE Can Tell Us
While the current returns on capital are decent, they haven't changed much. The company has employed 51% more capital in the last five years, and the returns on that capital have remained stable at 14%. 14% is a pretty standard return, and it provides some comfort knowing that India has consistently earned this amount. Over long periods of time, returns like these might not be too exciting, but with consistency they can pay off in terms of share price returns.
On another note, while the change in ROCE trend might not scream for attention, it's interesting that the current liabilities have actually gone up over the last five years. This is intriguing because if current liabilities hadn't increased to 42% of total assets, this reported ROCE would probably be less than14% because total capital employed would be higher.The 14% ROCE could be even lower if current liabilities weren't 42% of total assets, because the the formula would show a larger base of total capital employed. So with current liabilities at such high levels, this effectively means the likes of suppliers or short-term creditors are funding a meaningful part of the business, which in some instances can bring some risks.
The Bottom Line
In the end, India has proven its ability to adequately reinvest capital at good rates of return. However, over the last five years, the stock has only delivered a 29% return to shareholders who held over that period. So to determine if India is a multi-bagger going forward, we'd suggest digging deeper into the company's other fundamentals.
One more thing: We've identified 3 warning signs with India (at least 1 which is a bit unpleasant) , and understanding them would certainly be useful.
If you want to search for solid companies with great earnings, check out this free list of companies with good balance sheets and impressive returns on equity.
When trading India or any other investment, use the platform considered by many to be the Professional's Gateway to the Worlds Market, Interactive Brokers. You get the lowest-cost* trading on stocks, options, futures, forex, bonds and funds worldwide from a single integrated account. Promoted
New: Manage All Your Stock Portfolios in One Place
We've created the ultimate portfolio companion for stock investors, and it's free.
• Connect an unlimited number of Portfolios and see your total in one currency
• Be alerted to new Warning Signs or Risks via email or mobile
• Track the Fair Value of your stocks
This article by Simply Wall St is general in nature. It does not constitute a recommendation to buy or sell any stock, and does not take account of your objectives, or your financial situation. We aim to bring you long-term focused analysis driven by fundamental data. Note that our analysis may not factor in the latest price-sensitive company announcements or qualitative material. Simply Wall St has no position in any stocks mentioned.
*Interactive Brokers Rated Lowest Cost Broker by StockBrokers.com Annual Online Review 2020
Have feedback on this article? Concerned about the content? Get in touch with us directly. Alternatively, email editorial-team (at) simplywallst.com.
About NSEI:PTC
PTC India
Engages in the trading of power in India, Nepal, Bhutan, and Bangladesh.
Excellent balance sheet established dividend payer.
