- India
- /
- Electric Utilities
- /
- NSEI:CESC
Returns On Capital Signal Difficult Times Ahead For CESC (NSE:CESC)

Ignoring the stock price of a company, what are the underlying trends that tell us a business is past the growth phase? Businesses in decline often have two underlying trends, firstly, a declining return on capital employed (ROCE) and a declining base of capital employed. This indicates the company is producing less profit from its investments and its total assets are decreasing. And from a first read, things don't look too good at CESC (NSE:CESC), so let's see why.
What Is Return On Capital Employed (ROCE)?
If you haven't worked with ROCE before, it measures the 'return' (pre-tax profit) a company generates from capital employed in its business. The formula for this calculation on CESC is:
Return on Capital Employed = Earnings Before Interest and Tax (EBIT) ÷ (Total Assets - Current Liabilities)
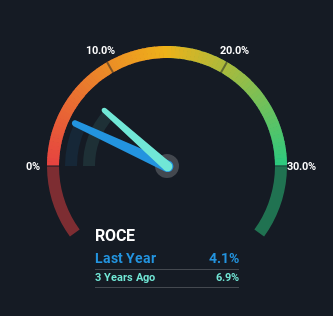
0.041 = ₹12b ÷ (₹382b - ₹83b) (Based on the trailing twelve months to December 2023).
Thus, CESC has an ROCE of 4.1%. Ultimately, that's a low return and it under-performs the Electric Utilities industry average of 7.4%.
See our latest analysis for CESC
In the above chart we have measured CESC's prior ROCE against its prior performance, but the future is arguably more important. If you'd like to see what analysts are forecasting going forward, you should check out our free report for CESC.
What The Trend Of ROCE Can Tell Us
We are a bit worried about the trend of returns on capital at CESC. About five years ago, returns on capital were 8.1%, however they're now substantially lower than that as we saw above. Meanwhile, capital employed in the business has stayed roughly the flat over the period. Since returns are falling and the business has the same amount of assets employed, this can suggest it's a mature business that hasn't had much growth in the last five years. If these trends continue, we wouldn't expect CESC to turn into a multi-bagger.
The Bottom Line On CESC's ROCE
In summary, it's unfortunate that CESC is generating lower returns from the same amount of capital. The market must be rosy on the stock's future because even though the underlying trends aren't too encouraging, the stock has soared 165%. In any case, the current underlying trends don't bode well for long term performance so unless they reverse, we'd start looking elsewhere.
One more thing to note, we've identified 1 warning sign with CESC and understanding it should be part of your investment process.
If you want to search for solid companies with great earnings, check out this free list of companies with good balance sheets and impressive returns on equity.
The New Payments ETF Is Live on NASDAQ:
Money is moving to real-time rails, and a newly listed ETF now gives investors direct exposure. Fast settlement. Institutional custody. Simple access.
Explore how this launch could reshape portfolios
Sponsored ContentNew: AI Stock Screener & Alerts
Our new AI Stock Screener scans the market every day to uncover opportunities.
• Dividend Powerhouses (3%+ Yield)
• Undervalued Small Caps with Insider Buying
• High growth Tech and AI Companies
Or build your own from over 50 metrics.
Have feedback on this article? Concerned about the content? Get in touch with us directly. Alternatively, email editorial-team (at) simplywallst.com.
This article by Simply Wall St is general in nature. We provide commentary based on historical data and analyst forecasts only using an unbiased methodology and our articles are not intended to be financial advice. It does not constitute a recommendation to buy or sell any stock, and does not take account of your objectives, or your financial situation. We aim to bring you long-term focused analysis driven by fundamental data. Note that our analysis may not factor in the latest price-sensitive company announcements or qualitative material. Simply Wall St has no position in any stocks mentioned.
About NSEI:CESC
CESC
An integrated electrical utility company, engages in the generation and distribution of electricity in India.
6 star dividend payer and good value.
Similar Companies
Market Insights

Weekly Picks

Early mover in a fast growing industry. Likely to experience share price volatility as they scale


A case for CA$31.80 (undiluted), aka 8,616% upside from CA$0.37 (an 86 bagger!).


Moderation and Stabilisation: HOLD: Fair Price based on a 4-year Cycle is $12.08
Recently Updated Narratives


Title: Market Sentiment Is Dead Wrong — Here's Why PSEC Deserves a Second Look


An amazing opportunity to potentially get a 100 bagger

Amazon: Why the World’s Biggest Platform Still Runs on Invisible Economics
Popular Narratives


Crazy Undervalued 42 Baggers Silver Play (Active & Running Mine)


MicroVision will explode future revenue by 380.37% with a vision towards success


NVDA: Expanding AI Demand Will Drive Major Data Center Investments Through 2026
Trending Discussion
