
Advertisement
- India
- /
- Transportation
- /
- NSEI:OBCL
Some Confidence Is Lacking In Orissa Bengal Carrier Limited (NSE:OBCL) As Shares Slide 27%

Orissa Bengal Carrier Limited (NSE:OBCL) shareholders won't be pleased to see that the share price has had a very rough month, dropping 27% and undoing the prior period's positive performance. The recent drop has obliterated the annual return, with the share price now down 4.0% over that longer period.
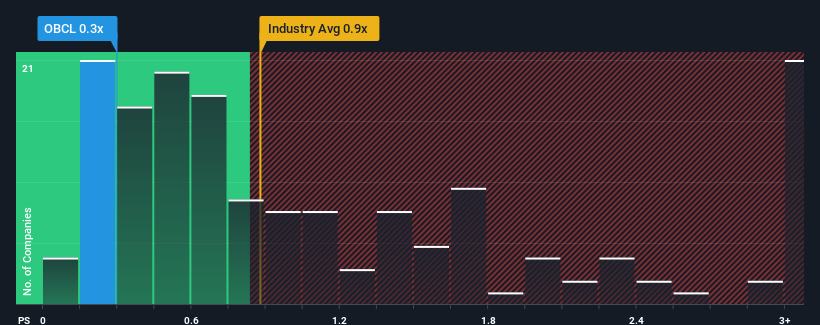
Even after such a large drop in price, it's still not a stretch to say that Orissa Bengal Carrier's price-to-sales (or "P/S") ratio of 0.3x right now seems quite "middle-of-the-road" compared to the Transportation industry in India, where the median P/S ratio is around 0.8x. While this might not raise any eyebrows, if the P/S ratio is not justified investors could be missing out on a potential opportunity or ignoring looming disappointment.
See our latest analysis for Orissa Bengal Carrier
What Does Orissa Bengal Carrier's Recent Performance Look Like?
For instance, Orissa Bengal Carrier's receding revenue in recent times would have to be some food for thought. Perhaps investors believe the recent revenue performance is enough to keep in line with the industry, which is keeping the P/S from dropping off. If you like the company, you'd at least be hoping this is the case so that you could potentially pick up some stock while it's not quite in favour.
Want the full picture on earnings, revenue and cash flow for the company? Then our free report on Orissa Bengal Carrier will help you shine a light on its historical performance.What Are Revenue Growth Metrics Telling Us About The P/S?
In order to justify its P/S ratio, Orissa Bengal Carrier would need to produce growth that's similar to the industry.
In reviewing the last year of financials, we were disheartened to see the company's revenues fell to the tune of 8.0%. At least revenue has managed not to go completely backwards from three years ago in aggregate, thanks to the earlier period of growth. Therefore, it's fair to say that revenue growth has been inconsistent recently for the company.
Comparing that to the industry, which is predicted to deliver 8.6% growth in the next 12 months, the company's momentum is weaker, based on recent medium-term annualised revenue results.
With this in mind, we find it intriguing that Orissa Bengal Carrier's P/S is comparable to that of its industry peers. Apparently many investors in the company are less bearish than recent times would indicate and aren't willing to let go of their stock right now. They may be setting themselves up for future disappointment if the P/S falls to levels more in line with recent growth rates.
The Bottom Line On Orissa Bengal Carrier's P/S
Following Orissa Bengal Carrier's share price tumble, its P/S is just clinging on to the industry median P/S. Typically, we'd caution against reading too much into price-to-sales ratios when settling on investment decisions, though it can reveal plenty about what other market participants think about the company.
Our examination of Orissa Bengal Carrier revealed its poor three-year revenue trends aren't resulting in a lower P/S as per our expectations, given they look worse than current industry outlook. When we see weak revenue with slower than industry growth, we suspect the share price is at risk of declining, bringing the P/S back in line with expectations. Unless there is a significant improvement in the company's medium-term performance, it will be difficult to prevent the P/S ratio from declining to a more reasonable level.
We don't want to rain on the parade too much, but we did also find 5 warning signs for Orissa Bengal Carrier (1 doesn't sit too well with us!) that you need to be mindful of.
It's important to make sure you look for a great company, not just the first idea you come across. So if growing profitability aligns with your idea of a great company, take a peek at this free list of interesting companies with strong recent earnings growth (and a low P/E).
New: AI Stock Screener & Alerts
Our new AI Stock Screener scans the market every day to uncover opportunities.
• Dividend Powerhouses (3%+ Yield)
• Undervalued Small Caps with Insider Buying
• High growth Tech and AI Companies
Or build your own from over 50 metrics.
Have feedback on this article? Concerned about the content? Get in touch with us directly. Alternatively, email editorial-team (at) simplywallst.com.
This article by Simply Wall St is general in nature. We provide commentary based on historical data and analyst forecasts only using an unbiased methodology and our articles are not intended to be financial advice. It does not constitute a recommendation to buy or sell any stock, and does not take account of your objectives, or your financial situation. We aim to bring you long-term focused analysis driven by fundamental data. Note that our analysis may not factor in the latest price-sensitive company announcements or qualitative material. Simply Wall St has no position in any stocks mentioned.
About NSEI:OBCL
Orissa Bengal Carrier
Provides transportation and logistics services in India.
Slight with acceptable track record.
Similar Companies
Market Insights

Advertisement
Community Narratives
Groundbreaking therapies that could change the treatment landscape for PTSD, fibromyalgia, MS & Alzheimer’s
Fair Value US$6.20|86.9% undervalued
CM
Community Contributor
DigitalOcean Will Grow 14% by Embracing AI with Paperspace Acquisition
Fair Value US$50.00|41.7% undervalued
NE
Community Contributor
Viant Technology: A Rising AdTech Challenger in the AI-Powered CTV Market
Fair Value US$38.61|63.2% undervalued
BL
Community Contributor
Volvo will Accelerate Forward into Electric and Autonomous Leadership in Five Years
Fair Value SEK 438.80|39.7% undervalued
UN
Community Contributor