
Advertisement
- India
- /
- Telecom Services and Carriers
- /
- NSEI:INDUSTOWER
These 4 Measures Indicate That Indus Towers (NSE:INDUSTOWER) Is Using Debt Reasonably Well
Legendary fund manager Li Lu (who Charlie Munger backed) once said, 'The biggest investment risk is not the volatility of prices, but whether you will suffer a permanent loss of capital.' So it seems the smart money knows that debt - which is usually involved in bankruptcies - is a very important factor, when you assess how risky a company is. We note that Indus Towers Limited (NSE:INDUSTOWER) does have debt on its balance sheet. But the real question is whether this debt is making the company risky.
Why Does Debt Bring Risk?
Debt and other liabilities become risky for a business when it cannot easily fulfill those obligations, either with free cash flow or by raising capital at an attractive price. In the worst case scenario, a company can go bankrupt if it cannot pay its creditors. However, a more usual (but still expensive) situation is where a company must dilute shareholders at a cheap share price simply to get debt under control. Of course, the upside of debt is that it often represents cheap capital, especially when it replaces dilution in a company with the ability to reinvest at high rates of return. The first step when considering a company's debt levels is to consider its cash and debt together.
Check out our latest analysis for Indus Towers
What Is Indus Towers's Debt?
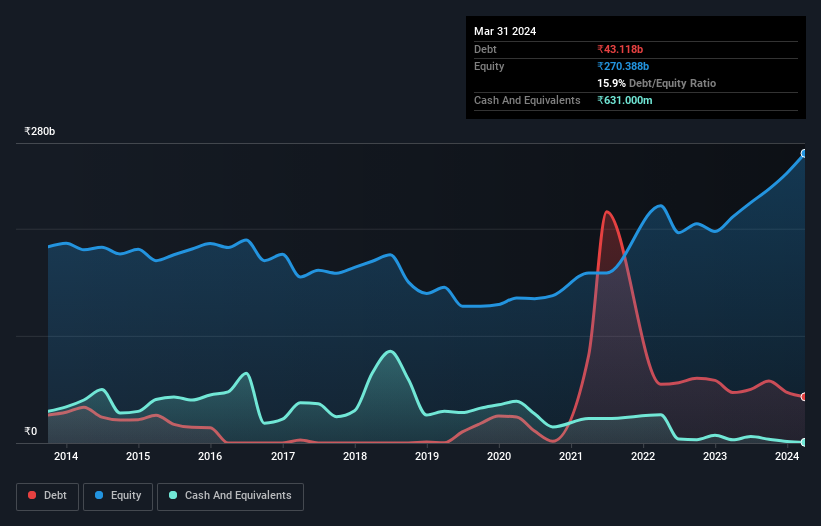
You can click the graphic below for the historical numbers, but it shows that Indus Towers had ₹43.1b of debt in March 2024, down from ₹47.1b, one year before. And it doesn't have much cash, so its net debt is about the same.
How Strong Is Indus Towers' Balance Sheet?
We can see from the most recent balance sheet that Indus Towers had liabilities of ₹101.6b falling due within a year, and liabilities of ₹186.7b due beyond that. Offsetting these obligations, it had cash of ₹631.0m as well as receivables valued at ₹64.5b due within 12 months. So its liabilities total ₹223.2b more than the combination of its cash and short-term receivables.
Indus Towers has a very large market capitalization of ₹1.10t, so it could very likely raise cash to ameliorate its balance sheet, if the need arose. However, it is still worthwhile taking a close look at its ability to pay off debt.
In order to size up a company's debt relative to its earnings, we calculate its net debt divided by its earnings before interest, tax, depreciation, and amortization (EBITDA) and its earnings before interest and tax (EBIT) divided by its interest expense (its interest cover). The advantage of this approach is that we take into account both the absolute quantum of debt (with net debt to EBITDA) and the actual interest expenses associated with that debt (with its interest cover ratio).
Indus Towers's net debt is only 0.29 times its EBITDA. And its EBIT easily covers its interest expense, being 11.7 times the size. So we're pretty relaxed about its super-conservative use of debt. In addition to that, we're happy to report that Indus Towers has boosted its EBIT by 89%, thus reducing the spectre of future debt repayments. When analysing debt levels, the balance sheet is the obvious place to start. But it is future earnings, more than anything, that will determine Indus Towers's ability to maintain a healthy balance sheet going forward. So if you want to see what the professionals think, you might find this free report on analyst profit forecasts to be interesting.
Finally, while the tax-man may adore accounting profits, lenders only accept cold hard cash. So we always check how much of that EBIT is translated into free cash flow. Over the most recent three years, Indus Towers recorded free cash flow worth 56% of its EBIT, which is around normal, given free cash flow excludes interest and tax. This cold hard cash means it can reduce its debt when it wants to.
Our View
The good news is that Indus Towers's demonstrated ability to grow its EBIT delights us like a fluffy puppy does a toddler. And that's just the beginning of the good news since its interest cover is also very heartening. Zooming out, Indus Towers seems to use debt quite reasonably; and that gets the nod from us. While debt does bring risk, when used wisely it can also bring a higher return on equity. Over time, share prices tend to follow earnings per share, so if you're interested in Indus Towers, you may well want to click here to check an interactive graph of its earnings per share history.
At the end of the day, it's often better to focus on companies that are free from net debt. You can access our special list of such companies (all with a track record of profit growth). It's free.
New: AI Stock Screener & Alerts
Our new AI Stock Screener scans the market every day to uncover opportunities.
• Dividend Powerhouses (3%+ Yield)
• Undervalued Small Caps with Insider Buying
• High growth Tech and AI Companies
Or build your own from over 50 metrics.
Have feedback on this article? Concerned about the content? Get in touch with us directly. Alternatively, email editorial-team (at) simplywallst.com.
This article by Simply Wall St is general in nature. We provide commentary based on historical data and analyst forecasts only using an unbiased methodology and our articles are not intended to be financial advice. It does not constitute a recommendation to buy or sell any stock, and does not take account of your objectives, or your financial situation. We aim to bring you long-term focused analysis driven by fundamental data. Note that our analysis may not factor in the latest price-sensitive company announcements or qualitative material. Simply Wall St has no position in any stocks mentioned.
Have feedback on this article? Concerned about the content? Get in touch with us directly. Alternatively, email editorial-team@simplywallst.com
About NSEI:INDUSTOWER
Indus Towers
A telecom infrastructure company, engages in the operation and maintenance of wireless communication towers and related infrastructures for various telecom service providers in India, Nigeria, Uganda, and Zambia.
Undervalued with solid track record.
Similar Companies
Market Insights

Advertisement
Community Narratives
Finding The True Value Of A Logistics Powerhouse
Fair Value US$95.21|8.7% undervalued
NV
Community Contributor
Paradigm Biopharmaceuticals Will Lead Osteoarthritis Treatment with Zilosul's FDA Success
Fair Value AU$5.50|93.3% undervalued
AM
Community Contributor
Barrick Mining (ABX:CA): A Gold Hedge against a U.S. Shutdown
Fair Value CA$60.00|18.7% undervalued
GM
Community Contributor