
Advertisement
- India
- /
- Electronic Equipment and Components
- /
- NSEI:OPTIEMUS
The 12% return this week takes Optiemus Infracom's (NSE:OPTIEMUS) shareholders five-year gains to 943%
Long term investing can be life changing when you buy and hold the truly great businesses. While the best companies are hard to find, but they can generate massive returns over long periods. For example, the Optiemus Infracom Limited (NSE:OPTIEMUS) share price is up a whopping 936% in the last half decade, a handsome return for long term holders. And this is just one example of the epic gains achieved by some long term investors. On top of that, the share price is up 104% in about a quarter. Anyone who held for that rewarding ride would probably be keen to talk about it.
Since the stock has added ₹4.7b to its market cap in the past week alone, let's see if underlying performance has been driving long-term returns.
View our latest analysis for Optiemus Infracom
To quote Buffett, 'Ships will sail around the world but the Flat Earth Society will flourish. There will continue to be wide discrepancies between price and value in the marketplace...' One imperfect but simple way to consider how the market perception of a company has shifted is to compare the change in the earnings per share (EPS) with the share price movement.
During the five years of share price growth, Optiemus Infracom moved from a loss to profitability. Sometimes, the start of profitability is a major inflection point that can signal fast earnings growth to come, which in turn justifies very strong share price gains.
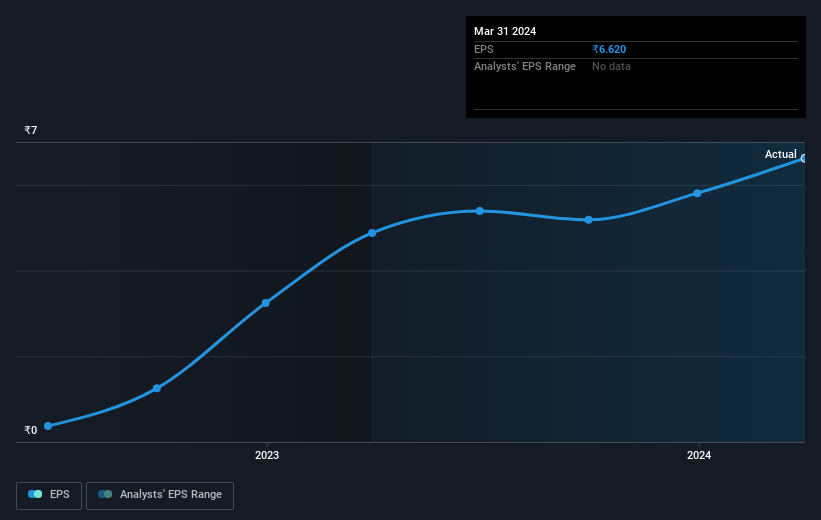
You can see how EPS has changed over time in the image below (click on the chart to see the exact values).
We're pleased to report that the CEO is remunerated more modestly than most CEOs at similarly capitalized companies. But while CEO remuneration is always worth checking, the really important question is whether the company can grow earnings going forward. Dive deeper into the earnings by checking this interactive graph of Optiemus Infracom's earnings, revenue and cash flow.
What About Dividends?
When looking at investment returns, it is important to consider the difference between total shareholder return (TSR) and share price return. The TSR is a return calculation that accounts for the value of cash dividends (assuming that any dividend received was reinvested) and the calculated value of any discounted capital raisings and spin-offs. It's fair to say that the TSR gives a more complete picture for stocks that pay a dividend. We note that for Optiemus Infracom the TSR over the last 5 years was 943%, which is better than the share price return mentioned above. And there's no prize for guessing that the dividend payments largely explain the divergence!
A Different Perspective
It's nice to see that Optiemus Infracom shareholders have received a total shareholder return of 121% over the last year. Of course, that includes the dividend. That gain is better than the annual TSR over five years, which is 60%. Therefore it seems like sentiment around the company has been positive lately. In the best case scenario, this may hint at some real business momentum, implying that now could be a great time to delve deeper. While it is well worth considering the different impacts that market conditions can have on the share price, there are other factors that are even more important. Take risks, for example - Optiemus Infracom has 2 warning signs we think you should be aware of.
Of course Optiemus Infracom may not be the best stock to buy. So you may wish to see this free collection of growth stocks.
Please note, the market returns quoted in this article reflect the market weighted average returns of stocks that currently trade on Indian exchanges.
New: AI Stock Screener & Alerts
Our new AI Stock Screener scans the market every day to uncover opportunities.
• Dividend Powerhouses (3%+ Yield)
• Undervalued Small Caps with Insider Buying
• High growth Tech and AI Companies
Or build your own from over 50 metrics.
Have feedback on this article? Concerned about the content? Get in touch with us directly. Alternatively, email editorial-team (at) simplywallst.com.
This article by Simply Wall St is general in nature. We provide commentary based on historical data and analyst forecasts only using an unbiased methodology and our articles are not intended to be financial advice. It does not constitute a recommendation to buy or sell any stock, and does not take account of your objectives, or your financial situation. We aim to bring you long-term focused analysis driven by fundamental data. Note that our analysis may not factor in the latest price-sensitive company announcements or qualitative material. Simply Wall St has no position in any stocks mentioned.
About NSEI:OPTIEMUS
Optiemus Infracom
Trades in mobile handset and mobile accessories in India and internationally.
Excellent balance sheet with acceptable track record.
Market Insights

Advertisement
Community Narratives
Kodiak AI - a potential 100 bagger opportunity?
Fair Value US$14.00|44.7% undervalued
DA
Community Contributor
A Fair Price for a Great Business Facing Real Threats
Fair Value US$383.06|13.0% undervalued
IM
Community Contributor
AXON And Shopify Integration Will Unlock Global Mobile Advertising
Fair Value US$646.30|0% overvalued
AN
Based on Analyst Price Targets