Are Wipro Limited (NSE:WIPRO) Investors Paying Above The Intrinsic Value?


Key Insights
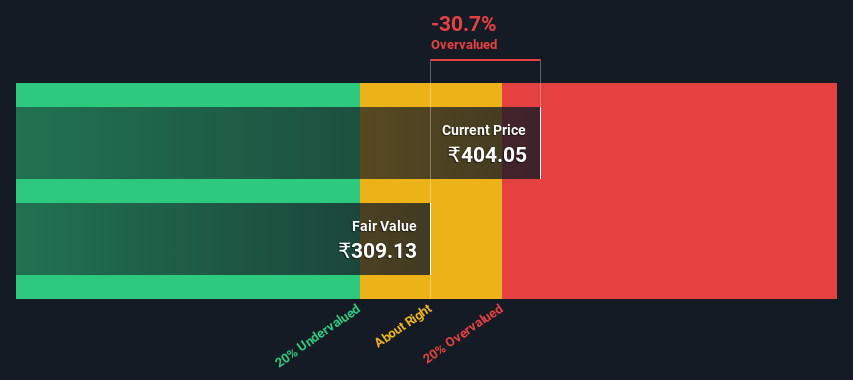
- Wipro's estimated fair value is ₹309 based on 2 Stage Free Cash Flow to Equity
- Wipro is estimated to be 31% overvalued based on current share price of ₹404
- Analyst price target for WIPRO is ₹392, which is 27% above our fair value estimate
Does the July share price for Wipro Limited (NSE:WIPRO) reflect what it's really worth? Today, we will estimate the stock's intrinsic value by estimating the company's future cash flows and discounting them to their present value. One way to achieve this is by employing the Discounted Cash Flow (DCF) model. Models like these may appear beyond the comprehension of a lay person, but they're fairly easy to follow.
Remember though, that there are many ways to estimate a company's value, and a DCF is just one method. Anyone interested in learning a bit more about intrinsic value should have a read of the Simply Wall St analysis model.
Check out our latest analysis for Wipro
Step By Step Through The Calculation
We're using the 2-stage growth model, which simply means we take in account two stages of company's growth. In the initial period the company may have a higher growth rate and the second stage is usually assumed to have a stable growth rate. To start off with, we need to estimate the next ten years of cash flows. Where possible we use analyst estimates, but when these aren't available we extrapolate the previous free cash flow (FCF) from the last estimate or reported value. We assume companies with shrinking free cash flow will slow their rate of shrinkage, and that companies with growing free cash flow will see their growth rate slow, over this period. We do this to reflect that growth tends to slow more in the early years than it does in later years.
A DCF is all about the idea that a dollar in the future is less valuable than a dollar today, so we discount the value of these future cash flows to their estimated value in today's dollars:
10-year free cash flow (FCF) forecast
| 2024 | 2025 | 2026 | 2027 | 2028 | 2029 | 2030 | 2031 | 2032 | 2033 | |
| Levered FCF (₹, Millions) | ₹132.0b | ₹131.3b | ₹143.3b | ₹169.0b | ₹217.3b | ₹247.8b | ₹277.3b | ₹306.0b | ₹334.4b | ₹363.0b |
| Growth Rate Estimate Source | Analyst x16 | Analyst x17 | Analyst x11 | Analyst x2 | Analyst x1 | Est @ 14.06% | Est @ 11.88% | Est @ 10.36% | Est @ 9.29% | Est @ 8.54% |
| Present Value (₹, Millions) Discounted @ 18% | ₹112.3k | ₹95.0k | ₹88.2k | ₹88.5k | ₹96.7k | ₹93.9k | ₹89.3k | ₹83.8k | ₹77.9k | ₹71.9k |
("Est" = FCF growth rate estimated by Simply Wall St)
Present Value of 10-year Cash Flow (PVCF) = ₹898b
The second stage is also known as Terminal Value, this is the business's cash flow after the first stage. For a number of reasons a very conservative growth rate is used that cannot exceed that of a country's GDP growth. In this case we have used the 5-year average of the 10-year government bond yield (6.8%) to estimate future growth. In the same way as with the 10-year 'growth' period, we discount future cash flows to today's value, using a cost of equity of 18%.
Terminal Value (TV)= FCF2033 × (1 + g) ÷ (r – g) = ₹363b× (1 + 6.8%) ÷ (18%– 6.8%) = ₹3.6t
Present Value of Terminal Value (PVTV)= TV / (1 + r)10= ₹3.6t÷ ( 1 + 18%)10= ₹714b
The total value is the sum of cash flows for the next ten years plus the discounted terminal value, which results in the Total Equity Value, which in this case is ₹1.6t. The last step is to then divide the equity value by the number of shares outstanding. Relative to the current share price of ₹404, the company appears potentially overvalued at the time of writing. Valuations are imprecise instruments though, rather like a telescope - move a few degrees and end up in a different galaxy. Do keep this in mind.
The Assumptions
The calculation above is very dependent on two assumptions. The first is the discount rate and the other is the cash flows. You don't have to agree with these inputs, I recommend redoing the calculations yourself and playing with them. The DCF also does not consider the possible cyclicality of an industry, or a company's future capital requirements, so it does not give a full picture of a company's potential performance. Given that we are looking at Wipro as potential shareholders, the cost of equity is used as the discount rate, rather than the cost of capital (or weighted average cost of capital, WACC) which accounts for debt. In this calculation we've used 18%, which is based on a levered beta of 1.107. Beta is a measure of a stock's volatility, compared to the market as a whole. We get our beta from the industry average beta of globally comparable companies, with an imposed limit between 0.8 and 2.0, which is a reasonable range for a stable business.
SWOT Analysis for Wipro
- Debt is not viewed as a risk.
- Dividends are covered by earnings and cash flows.
- Earnings growth over the past year underperformed the IT industry.
- Dividend is low compared to the top 25% of dividend payers in the IT market.
- Annual earnings are forecast to grow for the next 3 years.
- Good value based on P/E ratio compared to estimated Fair P/E ratio.
- Annual earnings are forecast to grow slower than the Indian market.
Moving On:
Valuation is only one side of the coin in terms of building your investment thesis, and it shouldn't be the only metric you look at when researching a company. It's not possible to obtain a foolproof valuation with a DCF model. Instead the best use for a DCF model is to test certain assumptions and theories to see if they would lead to the company being undervalued or overvalued. If a company grows at a different rate, or if its cost of equity or risk free rate changes sharply, the output can look very different. Can we work out why the company is trading at a premium to intrinsic value? For Wipro, we've put together three further factors you should further examine:
- Financial Health: Does WIPRO have a healthy balance sheet? Take a look at our free balance sheet analysis with six simple checks on key factors like leverage and risk.
- Management:Have insiders been ramping up their shares to take advantage of the market's sentiment for WIPRO's future outlook? Check out our management and board analysis with insights on CEO compensation and governance factors.
- Other Solid Businesses: Low debt, high returns on equity and good past performance are fundamental to a strong business. Why not explore our interactive list of stocks with solid business fundamentals to see if there are other companies you may not have considered!
PS. The Simply Wall St app conducts a discounted cash flow valuation for every stock on the NSEI every day. If you want to find the calculation for other stocks just search here.
If you're looking to trade Wipro, open an account with the lowest-cost platform trusted by professionals, Interactive Brokers.
With clients in over 200 countries and territories, and access to 160 markets, IBKR lets you trade stocks, options, futures, forex, bonds and funds from a single integrated account.
Enjoy no hidden fees, no account minimums, and FX conversion rates as low as 0.03%, far better than what most brokers offer.
Sponsored ContentValuation is complex, but we're here to simplify it.
Discover if Wipro might be undervalued or overvalued with our detailed analysis, featuring fair value estimates, potential risks, dividends, insider trades, and its financial condition.
Access Free AnalysisHave feedback on this article? Concerned about the content? Get in touch with us directly. Alternatively, email editorial-team (at) simplywallst.com.
This article by Simply Wall St is general in nature. We provide commentary based on historical data and analyst forecasts only using an unbiased methodology and our articles are not intended to be financial advice. It does not constitute a recommendation to buy or sell any stock, and does not take account of your objectives, or your financial situation. We aim to bring you long-term focused analysis driven by fundamental data. Note that our analysis may not factor in the latest price-sensitive company announcements or qualitative material. Simply Wall St has no position in any stocks mentioned.
About NSEI:WIPRO
Wipro
Operates as an information technology (IT), consulting, and business process services company worldwide.
Excellent balance sheet established dividend payer.

