
Advertisement
Howard Marks put it nicely when he said that, rather than worrying about share price volatility, 'The possibility of permanent loss is the risk I worry about... and every practical investor I know worries about.' It's only natural to consider a company's balance sheet when you examine how risky it is, since debt is often involved when a business collapses. As with many other companies Tech Mahindra Limited (NSE:TECHM) makes use of debt. But should shareholders be worried about its use of debt?
When Is Debt Dangerous?
Debt and other liabilities become risky for a business when it cannot easily fulfill those obligations, either with free cash flow or by raising capital at an attractive price. In the worst case scenario, a company can go bankrupt if it cannot pay its creditors. However, a more common (but still painful) scenario is that it has to raise new equity capital at a low price, thus permanently diluting shareholders. By replacing dilution, though, debt can be an extremely good tool for businesses that need capital to invest in growth at high rates of return. The first step when considering a company's debt levels is to consider its cash and debt together.
See our latest analysis for Tech Mahindra
What Is Tech Mahindra's Debt?
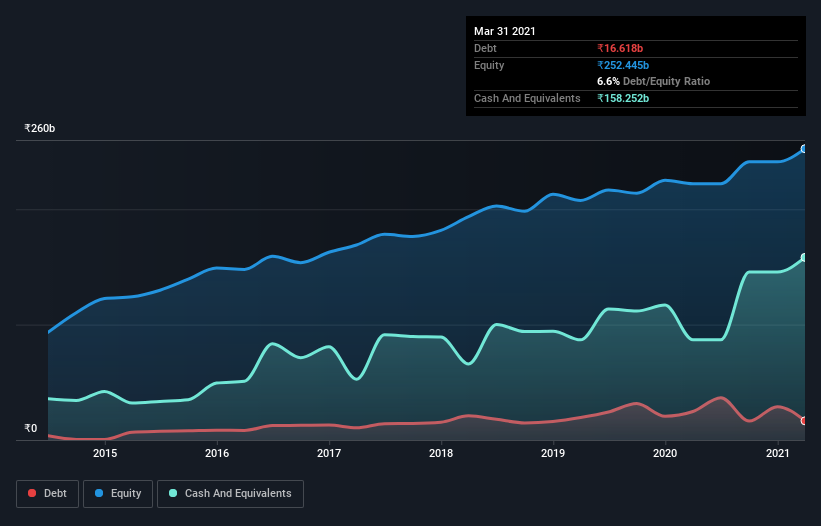
The image below, which you can click on for greater detail, shows that Tech Mahindra had debt of ₹16.6b at the end of March 2021, a reduction from ₹24.7b over a year. However, its balance sheet shows it holds ₹158.3b in cash, so it actually has ₹141.6b net cash.
How Healthy Is Tech Mahindra's Balance Sheet?
Zooming in on the latest balance sheet data, we can see that Tech Mahindra had liabilities of ₹102.8b due within 12 months and liabilities of ₹41.6b due beyond that. Offsetting this, it had ₹158.3b in cash and ₹64.7b in receivables that were due within 12 months. So it can boast ₹78.6b more liquid assets than total liabilities.
This surplus suggests that Tech Mahindra has a conservative balance sheet, and could probably eliminate its debt without much difficulty. Simply put, the fact that Tech Mahindra has more cash than debt is arguably a good indication that it can manage its debt safely.
Also positive, Tech Mahindra grew its EBIT by 25% in the last year, and that should make it easier to pay down debt, going forward. The balance sheet is clearly the area to focus on when you are analysing debt. But ultimately the future profitability of the business will decide if Tech Mahindra can strengthen its balance sheet over time. So if you're focused on the future you can check out this free report showing analyst profit forecasts.
But our final consideration is also important, because a company cannot pay debt with paper profits; it needs cold hard cash. While Tech Mahindra has net cash on its balance sheet, it's still worth taking a look at its ability to convert earnings before interest and tax (EBIT) to free cash flow, to help us understand how quickly it is building (or eroding) that cash balance. During the last three years, Tech Mahindra generated free cash flow amounting to a very robust 97% of its EBIT, more than we'd expect. That positions it well to pay down debt if desirable to do so.
Summing up
While we empathize with investors who find debt concerning, you should keep in mind that Tech Mahindra has net cash of ₹141.6b, as well as more liquid assets than liabilities. And it impressed us with free cash flow of ₹74b, being 97% of its EBIT. So we don't think Tech Mahindra's use of debt is risky. When analysing debt levels, the balance sheet is the obvious place to start. However, not all investment risk resides within the balance sheet - far from it. For example, we've discovered 2 warning signs for Tech Mahindra that you should be aware of before investing here.
If, after all that, you're more interested in a fast growing company with a rock-solid balance sheet, then check out our list of net cash growth stocks without delay.
If you decide to trade Tech Mahindra, use the lowest-cost* platform that is rated #1 Overall by Barron’s, Interactive Brokers. Trade stocks, options, futures, forex, bonds and funds on 135 markets, all from a single integrated account. Promoted
Valuation is complex, but we're here to simplify it.
Discover if Tech Mahindra might be undervalued or overvalued with our detailed analysis, featuring fair value estimates, potential risks, dividends, insider trades, and its financial condition.
Access Free AnalysisThis article by Simply Wall St is general in nature. It does not constitute a recommendation to buy or sell any stock, and does not take account of your objectives, or your financial situation. We aim to bring you long-term focused analysis driven by fundamental data. Note that our analysis may not factor in the latest price-sensitive company announcements or qualitative material. Simply Wall St has no position in any stocks mentioned.
*Interactive Brokers Rated Lowest Cost Broker by StockBrokers.com Annual Online Review 2020
Have feedback on this article? Concerned about the content? Get in touch with us directly. Alternatively, email editorial-team (at) simplywallst.com.
About NSEI:TECHM
Tech Mahindra
Provides information technology services and solutions in the Americas, Europe, India, and internationally.
Flawless balance sheet with proven track record and pays a dividend.
Similar Companies
Market Insights

Advertisement
Community Narratives
Quality at a Premium. A time to watch, not to buy?
Fair Value US$154.56|29.3% undervalued
DA
Community Contributor
GRAB: The Super-App at the Heart of Southeast Asia’s Digital Boom
Fair Value US$6.60|7.0% undervalued
BL
Community Contributor
Verve Group to Surge with 51.61% Revenue Growth
Fair Value €6.00|65.0% undervalued
ME
Community Contributor