
Advertisement
Declining Stock and Solid Fundamentals: Is The Market Wrong About Tanla Platforms Limited (NSE:TANLA)?

With its stock down 4.2% over the past three months, it is easy to disregard Tanla Platforms (NSE:TANLA). However, a closer look at its sound financials might cause you to think again. Given that fundamentals usually drive long-term market outcomes, the company is worth looking at. In this article, we decided to focus on Tanla Platforms' ROE.
Return on equity or ROE is a key measure used to assess how efficiently a company's management is utilizing the company's capital. Put another way, it reveals the company's success at turning shareholder investments into profits.
View our latest analysis for Tanla Platforms
How To Calculate Return On Equity?
ROE can be calculated by using the formula:
Return on Equity = Net Profit (from continuing operations) ÷ Shareholders' Equity
So, based on the above formula, the ROE for Tanla Platforms is:
29% = ₹5.5b ÷ ₹19b (Based on the trailing twelve months to June 2024).
The 'return' is the amount earned after tax over the last twelve months. One way to conceptualize this is that for each ₹1 of shareholders' capital it has, the company made ₹0.29 in profit.
Why Is ROE Important For Earnings Growth?
We have already established that ROE serves as an efficient profit-generating gauge for a company's future earnings. Depending on how much of these profits the company reinvests or "retains", and how effectively it does so, we are then able to assess a company’s earnings growth potential. Generally speaking, other things being equal, firms with a high return on equity and profit retention, have a higher growth rate than firms that don’t share these attributes.
A Side By Side comparison of Tanla Platforms' Earnings Growth And 29% ROE
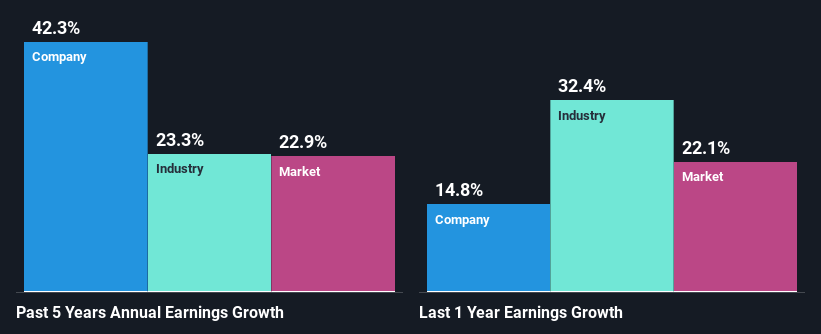
Firstly, we acknowledge that Tanla Platforms has a significantly high ROE. Secondly, even when compared to the industry average of 12% the company's ROE is quite impressive. So, the substantial 42% net income growth seen by Tanla Platforms over the past five years isn't overly surprising.
Next, on comparing with the industry net income growth, we found that Tanla Platforms' growth is quite high when compared to the industry average growth of 23% in the same period, which is great to see.
Earnings growth is a huge factor in stock valuation. What investors need to determine next is if the expected earnings growth, or the lack of it, is already built into the share price. This then helps them determine if the stock is placed for a bright or bleak future. One good indicator of expected earnings growth is the P/E ratio which determines the price the market is willing to pay for a stock based on its earnings prospects. So, you may want to check if Tanla Platforms is trading on a high P/E or a low P/E, relative to its industry.
Is Tanla Platforms Using Its Retained Earnings Effectively?
Tanla Platforms' three-year median payout ratio to shareholders is 23%, which is quite low. This implies that the company is retaining 77% of its profits. So it seems like the management is reinvesting profits heavily to grow its business and this reflects in its earnings growth number.
Moreover, Tanla Platforms is determined to keep sharing its profits with shareholders which we infer from its long history of nine years of paying a dividend. Our latest analyst data shows that the future payout ratio of the company is expected to rise to 29% over the next three years. Regardless, the ROE is not expected to change much for the company despite the higher expected payout ratio.
Conclusion
On the whole, we feel that Tanla Platforms' performance has been quite good. In particular, it's great to see that the company is investing heavily into its business and along with a high rate of return, that has resulted in a sizeable growth in its earnings. With that said, the latest industry analyst forecasts reveal that the company's earnings growth is expected to slow down. To know more about the latest analysts predictions for the company, check out this visualization of analyst forecasts for the company.
Valuation is complex, but we're here to simplify it.
Discover if Tanla Platforms might be undervalued or overvalued with our detailed analysis, featuring fair value estimates, potential risks, dividends, insider trades, and its financial condition.
Access Free AnalysisHave feedback on this article? Concerned about the content? Get in touch with us directly. Alternatively, email editorial-team (at) simplywallst.com.
This article by Simply Wall St is general in nature. We provide commentary based on historical data and analyst forecasts only using an unbiased methodology and our articles are not intended to be financial advice. It does not constitute a recommendation to buy or sell any stock, and does not take account of your objectives, or your financial situation. We aim to bring you long-term focused analysis driven by fundamental data. Note that our analysis may not factor in the latest price-sensitive company announcements or qualitative material. Simply Wall St has no position in any stocks mentioned.
About NSEI:TANLA
Tanla Platforms
Engages in the provision of cloud communication platforms as a service for mobile operators and enterprises in India and internationally.
Flawless balance sheet, undervalued and pays a dividend.
Similar Companies
Market Insights

Advertisement
Community Narratives
The Most Undervalued of the Magnificent 7
Fair Value US$237.43|37.8% undervalued
IN
Community Contributor
CSL is undervalued in High Tax Scenario
Fair Value AU$263.33|10.2% undervalued
RA
Community Contributor
PVA TePla's New Strategy Aims for 22% Revenue Growth in Semiconductor Recovery
Fair Value €19.19|20.8% undervalued
MI
Community Contributor