We're Hopeful That 63 moons technologies (NSE:FINANTECH) Will Use Its Cash Wisely
We can readily understand why investors are attracted to unprofitable companies. By way of example, 63 moons technologies (NSE:FINANTECH) has seen its share price rise 289% over the last year, delighting many shareholders. Nonetheless, only a fool would ignore the risk that a loss making company burns through its cash too quickly.
So notwithstanding the buoyant share price, we think it's well worth asking whether 63 moons technologies' cash burn is too risky. In this report, we will consider the company's annual negative free cash flow, henceforth referring to it as the 'cash burn'. Let's start with an examination of the business' cash, relative to its cash burn.
See our latest analysis for 63 moons technologies
How Long Is 63 moons technologies' Cash Runway?
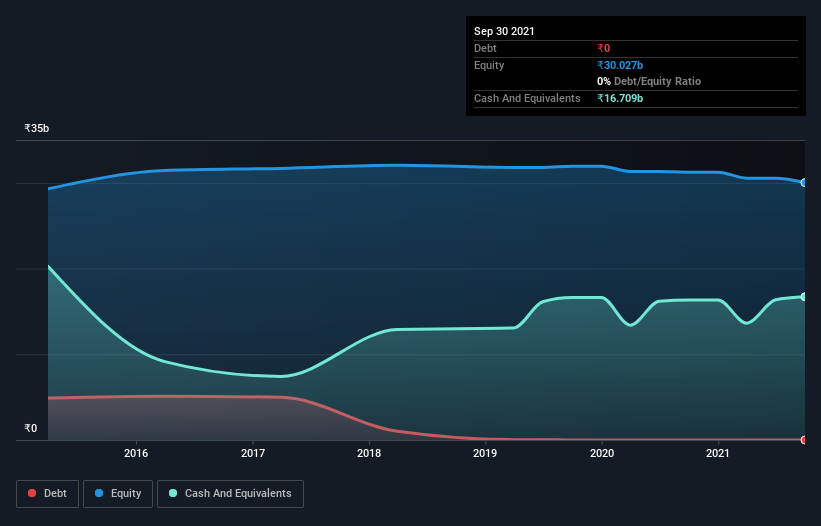
A company's cash runway is the amount of time it would take to burn through its cash reserves at its current cash burn rate. In September 2021, 63 moons technologies had ₹17b in cash, and was debt-free. In the last year, its cash burn was ₹779m. So it had a very long cash runway of many years from September 2021. While this is only one measure of its cash burn situation, it certainly gives us the impression that holders have nothing to worry about. The image below shows how its cash balance has been changing over the last few years.

How Well Is 63 moons technologies Growing?
Some investors might find it troubling that 63 moons technologies is actually increasing its cash burn, which is up 2.7% in the last year. At least the revenue was up 2.8% during the period, even if it wasn't up by much. In light of the data above, we're fairly sanguine about the business growth trajectory. Of course, we've only taken a quick look at the stock's growth metrics, here. This graph of historic earnings and revenue shows how 63 moons technologies is building its business over time.
How Easily Can 63 moons technologies Raise Cash?
There's no doubt 63 moons technologies seems to be in a fairly good position, when it comes to managing its cash burn, but even if it's only hypothetical, it's always worth asking how easily it could raise more money to fund growth. Companies can raise capital through either debt or equity. Many companies end up issuing new shares to fund future growth. By looking at a company's cash burn relative to its market capitalisation, we gain insight on how much shareholders would be diluted if the company needed to raise enough cash to cover another year's cash burn.
63 moons technologies' cash burn of ₹779m is about 5.6% of its ₹14b market capitalisation. That's a low proportion, so we figure the company would be able to raise more cash to fund growth, with a little dilution, or even to simply borrow some money.
How Risky Is 63 moons technologies' Cash Burn Situation?
As you can probably tell by now, we're not too worried about 63 moons technologies' cash burn. In particular, we think its cash runway stands out as evidence that the company is well on top of its spending. Although its increasing cash burn does give us reason for pause, the other metrics we discussed in this article form a positive picture overall. Based on the factors mentioned in this article, we think its cash burn situation warrants some attention from shareholders, but we don't think they should be worried. Separately, we looked at different risks affecting the company and spotted 3 warning signs for 63 moons technologies (of which 1 doesn't sit too well with us!) you should know about.
Of course 63 moons technologies may not be the best stock to buy. So you may wish to see this free collection of companies boasting high return on equity, or this list of stocks that insiders are buying.
Mobile Infrastructure for Defense and Disaster
The next wave in robotics isn't humanoid. Its fully autonomous towers delivering 5G, ISR, and radar in under 30 minutes, anywhere.
Get the investor briefing before the next round of contracts
Sponsored On Behalf of CiTechValuation is complex, but we're here to simplify it.
Discover if 63 moons technologies might be undervalued or overvalued with our detailed analysis, featuring fair value estimates, potential risks, dividends, insider trades, and its financial condition.
Access Free AnalysisHave feedback on this article? Concerned about the content? Get in touch with us directly. Alternatively, email editorial-team (at) simplywallst.com.
This article by Simply Wall St is general in nature. We provide commentary based on historical data and analyst forecasts only using an unbiased methodology and our articles are not intended to be financial advice. It does not constitute a recommendation to buy or sell any stock, and does not take account of your objectives, or your financial situation. We aim to bring you long-term focused analysis driven by fundamental data. Note that our analysis may not factor in the latest price-sensitive company announcements or qualitative material. Simply Wall St has no position in any stocks mentioned.
About NSEI:63MOONS
63 moons technologies
Provides software solutions in India and internationally.
Mediocre balance sheet with weak fundamentals.
Similar Companies
Market Insights
Weekly Picks

Early mover in a fast growing industry. Likely to experience share price volatility as they scale


A case for CA$31.80 (undiluted), aka 8,616% upside from CA$0.37 (an 86 bagger!).


Moderation and Stabilisation: HOLD: Fair Price based on a 4-year Cycle is $12.08
Recently Updated Narratives


An amazing opportunity to potentially get a 100 bagger

Amazon: Why the World’s Biggest Platform Still Runs on Invisible Economics

Sunrun Stock: When the Energy Transition Collides With the Cost of Capital
Popular Narratives


MicroVision will explode future revenue by 380.37% with a vision towards success


Crazy Undervalued 42 Baggers Silver Play (Active & Running Mine)


NVDA: Expanding AI Demand Will Drive Major Data Center Investments Through 2026
Trending Discussion


