
Advertisement
- India
- /
- Specialty Stores
- /
- NSEI:CARTRADE
These 4 Measures Indicate That CarTrade Tech (NSE:CARTRADE) Is Using Debt Safely
Warren Buffett famously said, 'Volatility is far from synonymous with risk.' When we think about how risky a company is, we always like to look at its use of debt, since debt overload can lead to ruin. Importantly, CarTrade Tech Limited (NSE:CARTRADE) does carry debt. But the more important question is: how much risk is that debt creating?
Why Does Debt Bring Risk?
Debt and other liabilities become risky for a business when it cannot easily fulfill those obligations, either with free cash flow or by raising capital at an attractive price. In the worst case scenario, a company can go bankrupt if it cannot pay its creditors. However, a more common (but still painful) scenario is that it has to raise new equity capital at a low price, thus permanently diluting shareholders. Of course, the upside of debt is that it often represents cheap capital, especially when it replaces dilution in a company with the ability to reinvest at high rates of return. When we examine debt levels, we first consider both cash and debt levels, together.
See our latest analysis for CarTrade Tech
How Much Debt Does CarTrade Tech Carry?
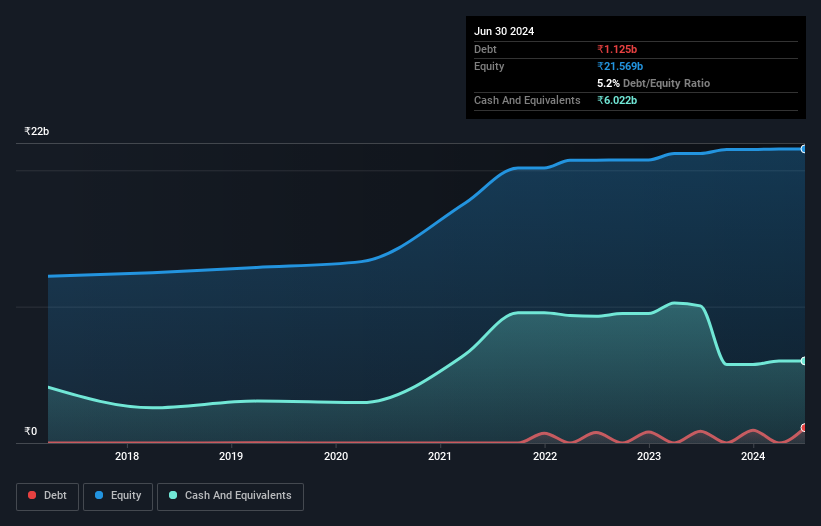
You can click the graphic below for the historical numbers, but it shows that as of March 2024 CarTrade Tech had ₹1.12b of debt, an increase on ₹864.3m, over one year. But on the other hand it also has ₹6.02b in cash, leading to a ₹4.90b net cash position.
How Strong Is CarTrade Tech's Balance Sheet?
The latest balance sheet data shows that CarTrade Tech had liabilities of ₹2.44b due within a year, and liabilities of ₹1.09b falling due after that. Offsetting this, it had ₹6.02b in cash and ₹732.8m in receivables that were due within 12 months. So it can boast ₹3.23b more liquid assets than total liabilities.
This surplus suggests that CarTrade Tech has a conservative balance sheet, and could probably eliminate its debt without much difficulty. Simply put, the fact that CarTrade Tech has more cash than debt is arguably a good indication that it can manage its debt safely.
Notably, CarTrade Tech's EBIT launched higher than Elon Musk, gaining a whopping 890% on last year. When analysing debt levels, the balance sheet is the obvious place to start. But ultimately the future profitability of the business will decide if CarTrade Tech can strengthen its balance sheet over time. So if you want to see what the professionals think, you might find this free report on analyst profit forecasts to be interesting.
Finally, while the tax-man may adore accounting profits, lenders only accept cold hard cash. CarTrade Tech may have net cash on the balance sheet, but it is still interesting to look at how well the business converts its earnings before interest and tax (EBIT) to free cash flow, because that will influence both its need for, and its capacity to manage debt. Happily for any shareholders, CarTrade Tech actually produced more free cash flow than EBIT over the last three years. There's nothing better than incoming cash when it comes to staying in your lenders' good graces.
Summing Up
While we empathize with investors who find debt concerning, you should keep in mind that CarTrade Tech has net cash of ₹4.90b, as well as more liquid assets than liabilities. The cherry on top was that in converted 101% of that EBIT to free cash flow, bringing in ₹130m. So is CarTrade Tech's debt a risk? It doesn't seem so to us. Above most other metrics, we think its important to track how fast earnings per share is growing, if at all. If you've also come to that realization, you're in luck, because today you can view this interactive graph of CarTrade Tech's earnings per share history for free.
If, after all that, you're more interested in a fast growing company with a rock-solid balance sheet, then check out our list of net cash growth stocks without delay.
New: AI Stock Screener & Alerts
Our new AI Stock Screener scans the market every day to uncover opportunities.
• Dividend Powerhouses (3%+ Yield)
• Undervalued Small Caps with Insider Buying
• High growth Tech and AI Companies
Or build your own from over 50 metrics.
Have feedback on this article? Concerned about the content? Get in touch with us directly. Alternatively, email editorial-team (at) simplywallst.com.
This article by Simply Wall St is general in nature. We provide commentary based on historical data and analyst forecasts only using an unbiased methodology and our articles are not intended to be financial advice. It does not constitute a recommendation to buy or sell any stock, and does not take account of your objectives, or your financial situation. We aim to bring you long-term focused analysis driven by fundamental data. Note that our analysis may not factor in the latest price-sensitive company announcements or qualitative material. Simply Wall St has no position in any stocks mentioned.
About NSEI:CARTRADE
CarTrade Tech
Operates a multi-channel online automotive platform in India and internationally.
Solid track record with excellent balance sheet.
Similar Companies
Market Insights

Advertisement
Community Narratives
Kodiak AI - a potential 100 bagger opportunity?
Fair Value US$14.00|44.7% undervalued
DA
Community Contributor
A Fair Price for a Great Business Facing Real Threats
Fair Value US$383.06|13.0% undervalued
IM
Community Contributor
AXON And Shopify Integration Will Unlock Global Mobile Advertising
Fair Value US$646.30|0% overvalued
AN
Based on Analyst Price Targets