Solara Active Pharma Sciences Limited (NSE:SOLARAPP) Soars 38% But It's A Story Of Risk Vs Reward


Solara Active Pharma Sciences Limited (NSE:SOLARAPP) shareholders would be excited to see that the share price has had a great month, posting a 38% gain and recovering from prior weakness. Longer-term shareholders would be thankful for the recovery in the share price since it's now virtually flat for the year after the recent bounce.
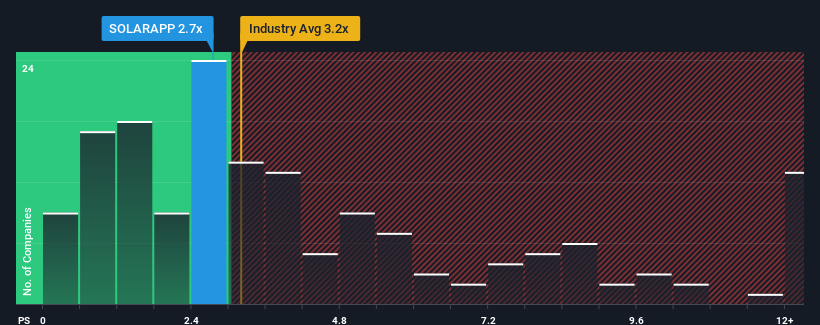
Although its price has surged higher, you could still be forgiven for feeling indifferent about Solara Active Pharma Sciences' P/S ratio of 2.7x, since the median price-to-sales (or "P/S") ratio for the Pharmaceuticals industry in India is also close to 3.2x. While this might not raise any eyebrows, if the P/S ratio is not justified investors could be missing out on a potential opportunity or ignoring looming disappointment.
Check out our latest analysis for Solara Active Pharma Sciences
How Has Solara Active Pharma Sciences Performed Recently?
While the industry has experienced revenue growth lately, Solara Active Pharma Sciences' revenue has gone into reverse gear, which is not great. Perhaps the market is expecting its poor revenue performance to improve, keeping the P/S from dropping. However, if this isn't the case, investors might get caught out paying too much for the stock.
Keen to find out how analysts think Solara Active Pharma Sciences' future stacks up against the industry? In that case, our free report is a great place to start.Is There Some Revenue Growth Forecasted For Solara Active Pharma Sciences?
Solara Active Pharma Sciences' P/S ratio would be typical for a company that's only expected to deliver moderate growth, and importantly, perform in line with the industry.
Retrospectively, the last year delivered a frustrating 11% decrease to the company's top line. As a result, revenue from three years ago have also fallen 22% overall. So unfortunately, we have to acknowledge that the company has not done a great job of growing revenue over that time.
Turning to the outlook, the next year should generate growth of 22% as estimated by the one analyst watching the company. Meanwhile, the rest of the industry is forecast to only expand by 13%, which is noticeably less attractive.
In light of this, it's curious that Solara Active Pharma Sciences' P/S sits in line with the majority of other companies. It may be that most investors aren't convinced the company can achieve future growth expectations.
What Does Solara Active Pharma Sciences' P/S Mean For Investors?
Solara Active Pharma Sciences' stock has a lot of momentum behind it lately, which has brought its P/S level with the rest of the industry. Typically, we'd caution against reading too much into price-to-sales ratios when settling on investment decisions, though it can reveal plenty about what other market participants think about the company.
We've established that Solara Active Pharma Sciences currently trades on a lower than expected P/S since its forecasted revenue growth is higher than the wider industry. Perhaps uncertainty in the revenue forecasts are what's keeping the P/S ratio consistent with the rest of the industry. At least the risk of a price drop looks to be subdued, but investors seem to think future revenue could see some volatility.
We don't want to rain on the parade too much, but we did also find 2 warning signs for Solara Active Pharma Sciences that you need to be mindful of.
If you're unsure about the strength of Solara Active Pharma Sciences' business, why not explore our interactive list of stocks with solid business fundamentals for some other companies you may have missed.
New: Manage All Your Stock Portfolios in One Place
We've created the ultimate portfolio companion for stock investors, and it's free.
• Connect an unlimited number of Portfolios and see your total in one currency
• Be alerted to new Warning Signs or Risks via email or mobile
• Track the Fair Value of your stocks
Have feedback on this article? Concerned about the content? Get in touch with us directly. Alternatively, email editorial-team (at) simplywallst.com.
This article by Simply Wall St is general in nature. We provide commentary based on historical data and analyst forecasts only using an unbiased methodology and our articles are not intended to be financial advice. It does not constitute a recommendation to buy or sell any stock, and does not take account of your objectives, or your financial situation. We aim to bring you long-term focused analysis driven by fundamental data. Note that our analysis may not factor in the latest price-sensitive company announcements or qualitative material. Simply Wall St has no position in any stocks mentioned.
About NSEI:SOLARAPP
Solara Active Pharma Sciences
Manufactures, produces, processes, formulates, sells, imports, exports, merchandises, distributes, trades in, and deals in active pharmaceutical ingredients (API) in India, Asia Pacific, Europe, North America, South America, and internationally.
Undervalued with reasonable growth potential.
Similar Companies
Market Insights

Community Narratives

