Sigachi Industries Limited's (NSE:SIGACHI) 27% Dip Still Leaving Some Shareholders Feeling Restless Over Its P/ERatio


The Sigachi Industries Limited (NSE:SIGACHI) share price has softened a substantial 27% over the previous 30 days, handing back much of the gains the stock has made lately. The good news is that in the last year, the stock has shone bright like a diamond, gaining 135%.
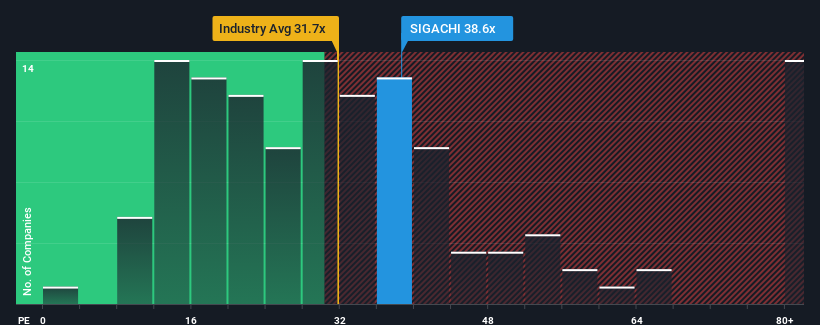
Although its price has dipped substantially, Sigachi Industries may still be sending bearish signals at the moment with its price-to-earnings (or "P/E") ratio of 38.6x, since almost half of all companies in India have P/E ratios under 28x and even P/E's lower than 15x are not unusual. Although, it's not wise to just take the P/E at face value as there may be an explanation why it's as high as it is.
For example, consider that Sigachi Industries' financial performance has been pretty ordinary lately as earnings growth is non-existent. One possibility is that the P/E is high because investors think the benign earnings growth will improve to outperform the broader market in the near future. If not, then existing shareholders may be a little nervous about the viability of the share price.
See our latest analysis for Sigachi Industries
Does Growth Match The High P/E?
The only time you'd be truly comfortable seeing a P/E as high as Sigachi Industries' is when the company's growth is on track to outshine the market.
If we review the last year of earnings, the company posted a result that saw barely any deviation from a year ago. Still, the latest three year period was better as it's delivered a decent 16% overall rise in EPS. So it appears to us that the company has had a mixed result in terms of growing earnings over that time.
Weighing that recent medium-term earnings trajectory against the broader market's one-year forecast for expansion of 24% shows it's noticeably less attractive on an annualised basis.
In light of this, it's alarming that Sigachi Industries' P/E sits above the majority of other companies. Apparently many investors in the company are way more bullish than recent times would indicate and aren't willing to let go of their stock at any price. Only the boldest would assume these prices are sustainable as a continuation of recent earnings trends is likely to weigh heavily on the share price eventually.
What We Can Learn From Sigachi Industries' P/E?
Despite the recent share price weakness, Sigachi Industries' P/E remains higher than most other companies. We'd say the price-to-earnings ratio's power isn't primarily as a valuation instrument but rather to gauge current investor sentiment and future expectations.
Our examination of Sigachi Industries revealed its three-year earnings trends aren't impacting its high P/E anywhere near as much as we would have predicted, given they look worse than current market expectations. When we see weak earnings with slower than market growth, we suspect the share price is at risk of declining, sending the high P/E lower. If recent medium-term earnings trends continue, it will place shareholders' investments at significant risk and potential investors in danger of paying an excessive premium.
We don't want to rain on the parade too much, but we did also find 3 warning signs for Sigachi Industries (1 is concerning!) that you need to be mindful of.
Of course, you might find a fantastic investment by looking at a few good candidates. So take a peek at this free list of companies with a strong growth track record, trading on a low P/E.
New: Manage All Your Stock Portfolios in One Place
We've created the ultimate portfolio companion for stock investors, and it's free.
• Connect an unlimited number of Portfolios and see your total in one currency
• Be alerted to new Warning Signs or Risks via email or mobile
• Track the Fair Value of your stocks
Have feedback on this article? Concerned about the content? Get in touch with us directly. Alternatively, email editorial-team (at) simplywallst.com.
This article by Simply Wall St is general in nature. We provide commentary based on historical data and analyst forecasts only using an unbiased methodology and our articles are not intended to be financial advice. It does not constitute a recommendation to buy or sell any stock, and does not take account of your objectives, or your financial situation. We aim to bring you long-term focused analysis driven by fundamental data. Note that our analysis may not factor in the latest price-sensitive company announcements or qualitative material. Simply Wall St has no position in any stocks mentioned.
About NSEI:SIGACHI
Sigachi Industries
Manufactures and sells microcrystalline cellulose and cellulose powder worldwide.
Solid track record with excellent balance sheet.
Similar Companies
Market Insights

Community Narratives


