Is Sanofi India Limited's (NSE:SANOFI) Recent Stock Performance Influenced By Its Fundamentals In Any Way?


Sanofi India's (NSE:SANOFI) stock is up by a considerable 7.0% over the past month. Given that stock prices are usually aligned with a company's financial performance in the long-term, we decided to study its financial indicators more closely to see if they had a hand to play in the recent price move. Particularly, we will be paying attention to Sanofi India's ROE today.
Return on equity or ROE is a key measure used to assess how efficiently a company's management is utilizing the company's capital. In short, ROE shows the profit each dollar generates with respect to its shareholder investments.
View our latest analysis for Sanofi India
How To Calculate Return On Equity?
The formula for ROE is:
Return on Equity = Net Profit (from continuing operations) ÷ Shareholders' Equity
So, based on the above formula, the ROE for Sanofi India is:
77% = ₹5.3b ÷ ₹6.8b (Based on the trailing twelve months to June 2024).
The 'return' is the yearly profit. Another way to think of that is that for every ₹1 worth of equity, the company was able to earn ₹0.77 in profit.
Why Is ROE Important For Earnings Growth?
Thus far, we have learned that ROE measures how efficiently a company is generating its profits. Depending on how much of these profits the company reinvests or "retains", and how effectively it does so, we are then able to assess a company’s earnings growth potential. Generally speaking, other things being equal, firms with a high return on equity and profit retention, have a higher growth rate than firms that don’t share these attributes.
Sanofi India's Earnings Growth And 77% ROE
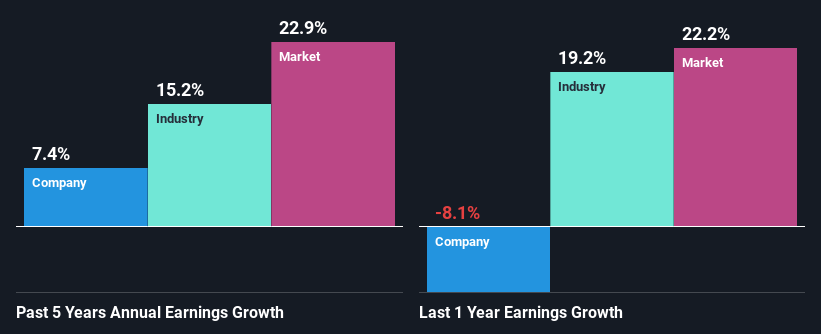
First thing first, we like that Sanofi India has an impressive ROE. Second, a comparison with the average ROE reported by the industry of 12% also doesn't go unnoticed by us. This probably laid the groundwork for Sanofi India's moderate 7.4% net income growth seen over the past five years.
As a next step, we compared Sanofi India's net income growth with the industry and were disappointed to see that the company's growth is lower than the industry average growth of 15% in the same period.
Earnings growth is an important metric to consider when valuing a stock. It’s important for an investor to know whether the market has priced in the company's expected earnings growth (or decline). This then helps them determine if the stock is placed for a bright or bleak future. Is Sanofi India fairly valued compared to other companies? These 3 valuation measures might help you decide.
Is Sanofi India Efficiently Re-investing Its Profits?
Sanofi India has a significant three-year median payout ratio of 71%, meaning that it is left with only 29% to reinvest into its business. This implies that the company has been able to achieve decent earnings growth despite returning most of its profits to shareholders.
Moreover, Sanofi India is determined to keep sharing its profits with shareholders which we infer from its long history of paying a dividend for at least ten years.
Summary
Overall, we feel that Sanofi India certainly does have some positive factors to consider. Its earnings have grown respectably as we saw earlier, which was likely due to the company reinvesting its earnings at a pretty high rate of return. However, given the high ROE, we do think that the company is reinvesting a small portion of its profits. This could likely be preventing the company from growing to its full extent. With that said, on studying the latest analyst forecasts, we found that while the company has seen growth in its past earnings, analysts expect its future earnings to shrink. To know more about the company's future earnings growth forecasts take a look at this free report on analyst forecasts for the company to find out more.
New: Manage All Your Stock Portfolios in One Place
We've created the ultimate portfolio companion for stock investors, and it's free.
• Connect an unlimited number of Portfolios and see your total in one currency
• Be alerted to new Warning Signs or Risks via email or mobile
• Track the Fair Value of your stocks
Have feedback on this article? Concerned about the content? Get in touch with us directly. Alternatively, email editorial-team (at) simplywallst.com.
This article by Simply Wall St is general in nature. We provide commentary based on historical data and analyst forecasts only using an unbiased methodology and our articles are not intended to be financial advice. It does not constitute a recommendation to buy or sell any stock, and does not take account of your objectives, or your financial situation. We aim to bring you long-term focused analysis driven by fundamental data. Note that our analysis may not factor in the latest price-sensitive company announcements or qualitative material. Simply Wall St has no position in any stocks mentioned.
About NSEI:SANOFI
Sanofi India
Manufactures and trades in drugs and pharmaceutical products in India, Singapore and internationally.
Excellent balance sheet, good value and pays a dividend.
Similar Companies
Market Insights

Community Narratives

