Little Excitement Around Lasa Supergenerics Limited's (NSE:LASA) Revenues As Shares Take 26% Pounding


Lasa Supergenerics Limited (NSE:LASA) shareholders won't be pleased to see that the share price has had a very rough month, dropping 26% and undoing the prior period's positive performance. Indeed, the recent drop has reduced its annual gain to a relatively sedate 7.9% over the last twelve months.
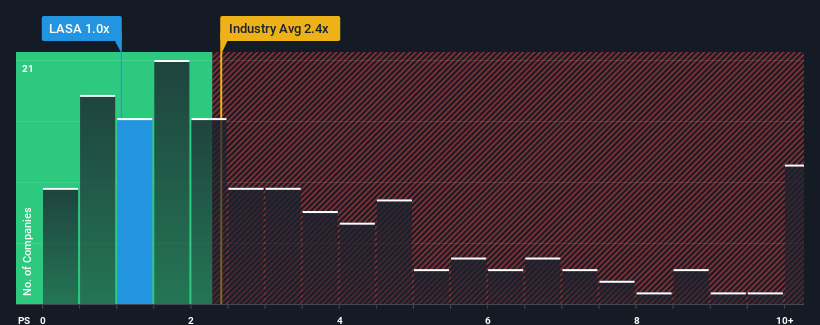
Since its price has dipped substantially, Lasa Supergenerics may be sending buy signals at present with its price-to-sales (or "P/S") ratio of 1x, considering almost half of all companies in the Pharmaceuticals industry in India have P/S ratios greater than 2.4x and even P/S higher than 5x aren't out of the ordinary. However, the P/S might be low for a reason and it requires further investigation to determine if it's justified.
View our latest analysis for Lasa Supergenerics
How Lasa Supergenerics Has Been Performing
As an illustration, revenue has deteriorated at Lasa Supergenerics over the last year, which is not ideal at all. One possibility is that the P/S is low because investors think the company won't do enough to avoid underperforming the broader industry in the near future. Those who are bullish on Lasa Supergenerics will be hoping that this isn't the case so that they can pick up the stock at a lower valuation.
We don't have analyst forecasts, but you can see how recent trends are setting up the company for the future by checking out our free report on Lasa Supergenerics' earnings, revenue and cash flow.What Are Revenue Growth Metrics Telling Us About The Low P/S?
There's an inherent assumption that a company should underperform the industry for P/S ratios like Lasa Supergenerics' to be considered reasonable.
Retrospectively, the last year delivered a frustrating 20% decrease to the company's top line. This means it has also seen a slide in revenue over the longer-term as revenue is down 45% in total over the last three years. Therefore, it's fair to say the revenue growth recently has been undesirable for the company.
Weighing that medium-term revenue trajectory against the broader industry's one-year forecast for expansion of 12% shows it's an unpleasant look.
With this in mind, we understand why Lasa Supergenerics' P/S is lower than most of its industry peers. Nonetheless, there's no guarantee the P/S has reached a floor yet with revenue going in reverse. Even just maintaining these prices could be difficult to achieve as recent revenue trends are already weighing down the shares.
What We Can Learn From Lasa Supergenerics' P/S?
Lasa Supergenerics' recently weak share price has pulled its P/S back below other Pharmaceuticals companies. Using the price-to-sales ratio alone to determine if you should sell your stock isn't sensible, however it can be a practical guide to the company's future prospects.
Our examination of Lasa Supergenerics confirms that the company's shrinking revenue over the past medium-term is a key factor in its low price-to-sales ratio, given the industry is projected to grow. Right now shareholders are accepting the low P/S as they concede future revenue probably won't provide any pleasant surprises either. If recent medium-term revenue trends continue, it's hard to see the share price moving strongly in either direction in the near future under these circumstances.
Having said that, be aware Lasa Supergenerics is showing 5 warning signs in our investment analysis, and 2 of those are a bit unpleasant.
If strong companies turning a profit tickle your fancy, then you'll want to check out this free list of interesting companies that trade on a low P/E (but have proven they can grow earnings).
If you're looking to trade Lasa Supergenerics, open an account with the lowest-cost platform trusted by professionals, Interactive Brokers.
With clients in over 200 countries and territories, and access to 160 markets, IBKR lets you trade stocks, options, futures, forex, bonds and funds from a single integrated account.
Enjoy no hidden fees, no account minimums, and FX conversion rates as low as 0.03%, far better than what most brokers offer.
Sponsored ContentNew: AI Stock Screener & Alerts
Our new AI Stock Screener scans the market every day to uncover opportunities.
• Dividend Powerhouses (3%+ Yield)
• Undervalued Small Caps with Insider Buying
• High growth Tech and AI Companies
Or build your own from over 50 metrics.
Have feedback on this article? Concerned about the content? Get in touch with us directly. Alternatively, email editorial-team (at) simplywallst.com.
This article by Simply Wall St is general in nature. We provide commentary based on historical data and analyst forecasts only using an unbiased methodology and our articles are not intended to be financial advice. It does not constitute a recommendation to buy or sell any stock, and does not take account of your objectives, or your financial situation. We aim to bring you long-term focused analysis driven by fundamental data. Note that our analysis may not factor in the latest price-sensitive company announcements or qualitative material. Simply Wall St has no position in any stocks mentioned.
About NSEI:LASA
Lasa Supergenerics
Engages in the research, manufacture, and marketing of animal and human healthcare products in India.
Excellent balance sheet low.
Market Insights

Community Narratives

