
Advertisement
Optimism for IOL Chemicals and Pharmaceuticals (NSE:IOLCP) has grown this past week, despite three-year decline in earnings
Investors can buy low cost index fund if they want to receive the average market return. But if you invest in individual stocks, some are likely to underperform. Unfortunately for shareholders, while the IOL Chemicals and Pharmaceuticals Limited (NSE:IOLCP) share price is up 47% in the last three years, that falls short of the market return. On the other hand, the more recent gain of 20% over a year is certainly pleasing.
Since it's been a strong week for IOL Chemicals and Pharmaceuticals shareholders, let's have a look at trend of the longer term fundamentals.
While the efficient markets hypothesis continues to be taught by some, it has been proven that markets are over-reactive dynamic systems, and investors are not always rational. By comparing earnings per share (EPS) and share price changes over time, we can get a feel for how investor attitudes to a company have morphed over time.
Over the last three years, IOL Chemicals and Pharmaceuticals failed to grow earnings per share, which fell 16% (annualized).
This means it's unlikely the market is judging the company based on earnings growth. Therefore, we think it's worth considering other metrics as well.
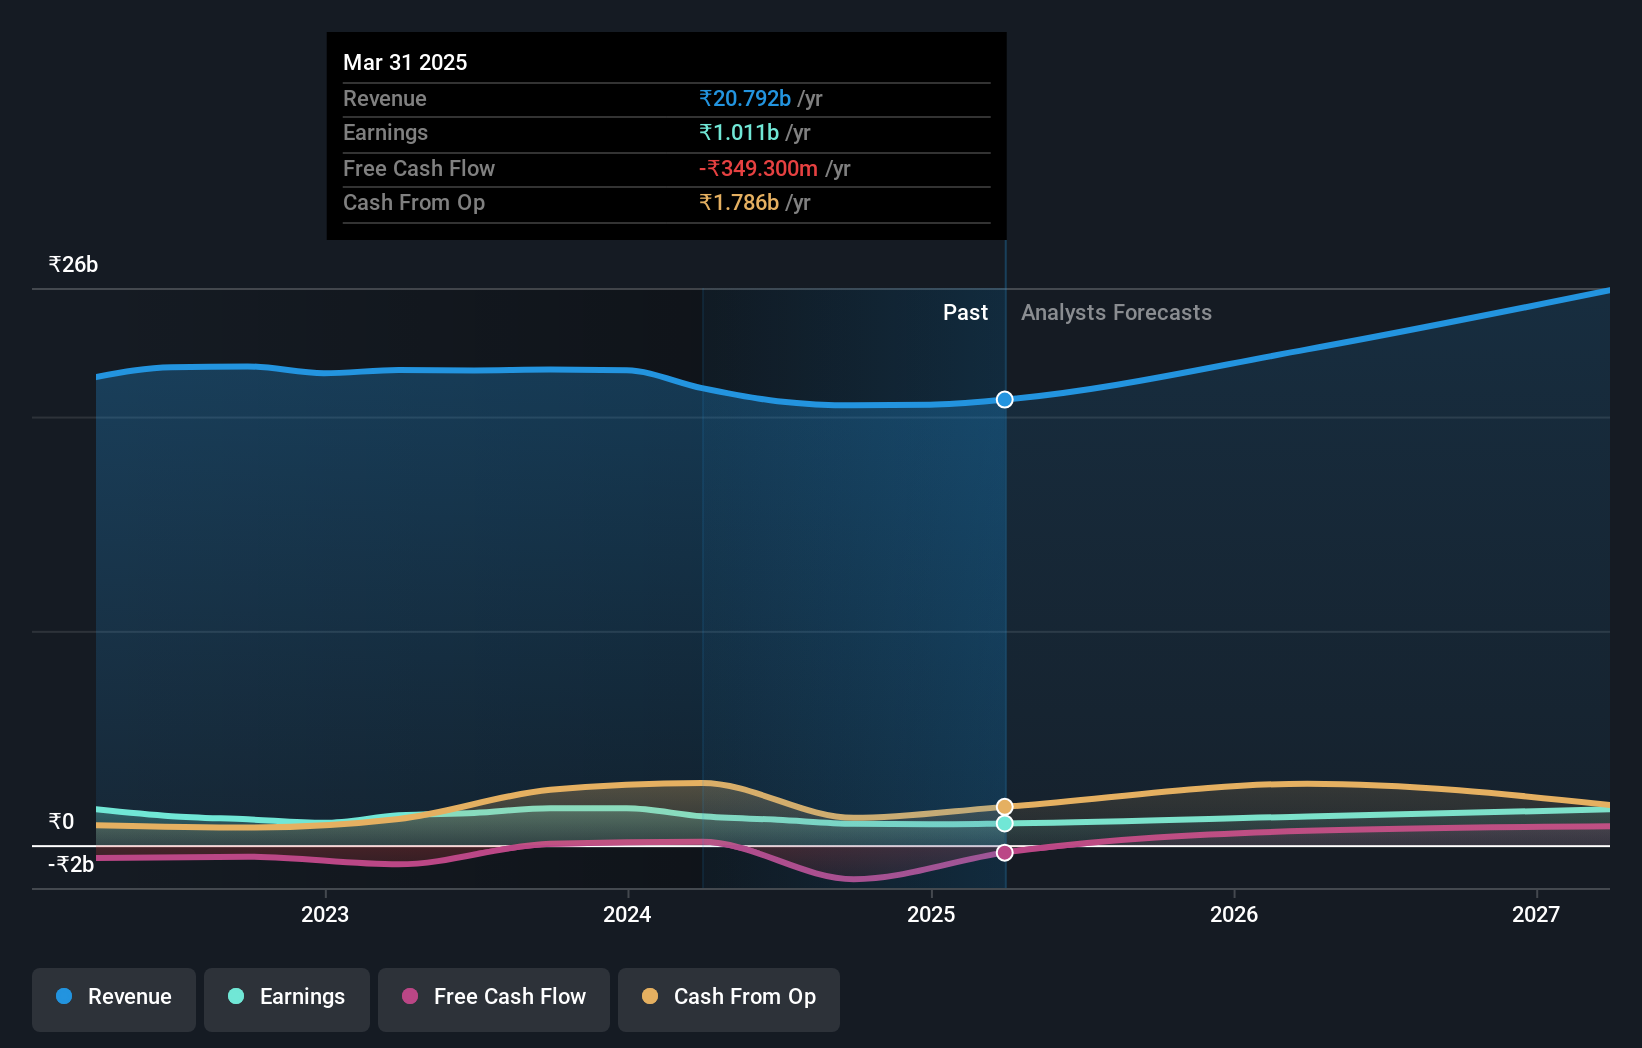
Languishing at just 0.8%, we doubt the dividend is doing much to prop up the share price. You can only imagine how long term shareholders feel about the declining revenue trend (slipping at 2.8% per year). What's clear is that historic earnings and revenue aren't matching up with the share price action, very well. So you might have to dig deeper to get a grasp of the situation
You can see below how earnings and revenue have changed over time (discover the exact values by clicking on the image).
You can see how its balance sheet has strengthened (or weakened) over time in this free interactive graphic.
What About Dividends?
It is important to consider the total shareholder return, as well as the share price return, for any given stock. The TSR is a return calculation that accounts for the value of cash dividends (assuming that any dividend received was reinvested) and the calculated value of any discounted capital raisings and spin-offs. So for companies that pay a generous dividend, the TSR is often a lot higher than the share price return. In the case of IOL Chemicals and Pharmaceuticals, it has a TSR of 53% for the last 3 years. That exceeds its share price return that we previously mentioned. The dividends paid by the company have thusly boosted the total shareholder return.
A Different Perspective
It's good to see that IOL Chemicals and Pharmaceuticals has rewarded shareholders with a total shareholder return of 22% in the last twelve months. Of course, that includes the dividend. That's better than the annualised return of 0.7% over half a decade, implying that the company is doing better recently. In the best case scenario, this may hint at some real business momentum, implying that now could be a great time to delve deeper. While it is well worth considering the different impacts that market conditions can have on the share price, there are other factors that are even more important. To that end, you should be aware of the 1 warning sign we've spotted with IOL Chemicals and Pharmaceuticals .
We will like IOL Chemicals and Pharmaceuticals better if we see some big insider buys. While we wait, check out this free list of undervalued stocks (mostly small caps) with considerable, recent, insider buying.
Please note, the market returns quoted in this article reflect the market weighted average returns of stocks that currently trade on Indian exchanges.
New: AI Stock Screener & Alerts
Our new AI Stock Screener scans the market every day to uncover opportunities.
• Dividend Powerhouses (3%+ Yield)
• Undervalued Small Caps with Insider Buying
• High growth Tech and AI Companies
Or build your own from over 50 metrics.
Have feedback on this article? Concerned about the content? Get in touch with us directly. Alternatively, email editorial-team (at) simplywallst.com.
This article by Simply Wall St is general in nature. We provide commentary based on historical data and analyst forecasts only using an unbiased methodology and our articles are not intended to be financial advice. It does not constitute a recommendation to buy or sell any stock, and does not take account of your objectives, or your financial situation. We aim to bring you long-term focused analysis driven by fundamental data. Note that our analysis may not factor in the latest price-sensitive company announcements or qualitative material. Simply Wall St has no position in any stocks mentioned.
About NSEI:IOLCP
IOL Chemicals and Pharmaceuticals
Manufactures and sells pharmaceutical and chemical products in India and internationally.
Flawless balance sheet with reasonable growth potential.
Similar Companies
Market Insights

Advertisement
Community Narratives
A formidable player in AI and enterprise computing.
Fair Value US$210.00|12.2% overvalued
CO
Community Contributor
IREN's Bold Moves in Sustainable Bitcoin Mining & AI Data Centers
Fair Value US$72.52|17.1% undervalued
BL
Community Contributor
Cooling the Champions: The Aussie Tech Behind F1's Victories
Fair Value AU$12.40|38.7% undervalued
TR
Community Contributor