Is Glenmark Pharmaceuticals Limited (NSE:GLENMARK) Expensive For A Reason? A Look At Its Intrinsic Value


Key Insights
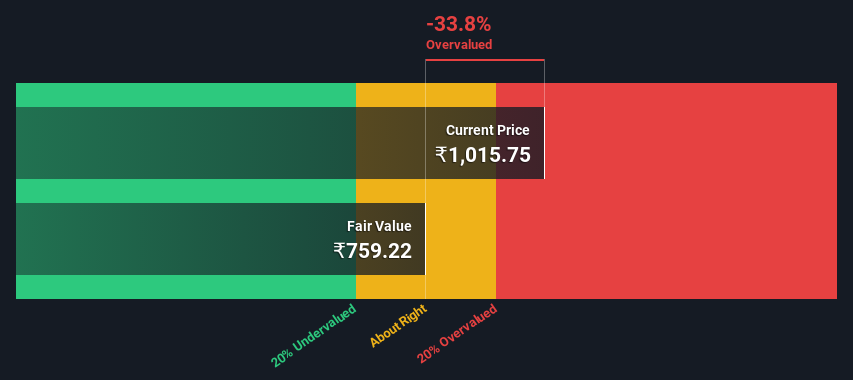
- Glenmark Pharmaceuticals' estimated fair value is ₹759 based on 2 Stage Free Cash Flow to Equity
- Glenmark Pharmaceuticals is estimated to be 34% overvalued based on current share price of ₹1,016
- Analyst price target for GLENMARK is ₹963, which is 27% above our fair value estimate
In this article we are going to estimate the intrinsic value of Glenmark Pharmaceuticals Limited (NSE:GLENMARK) by taking the expected future cash flows and discounting them to today's value. One way to achieve this is by employing the Discounted Cash Flow (DCF) model. Models like these may appear beyond the comprehension of a lay person, but they're fairly easy to follow.
We would caution that there are many ways of valuing a company and, like the DCF, each technique has advantages and disadvantages in certain scenarios. Anyone interested in learning a bit more about intrinsic value should have a read of the Simply Wall St analysis model.
See our latest analysis for Glenmark Pharmaceuticals
Is Glenmark Pharmaceuticals Fairly Valued?
We're using the 2-stage growth model, which simply means we take in account two stages of company's growth. In the initial period the company may have a higher growth rate and the second stage is usually assumed to have a stable growth rate. In the first stage we need to estimate the cash flows to the business over the next ten years. Where possible we use analyst estimates, but when these aren't available we extrapolate the previous free cash flow (FCF) from the last estimate or reported value. We assume companies with shrinking free cash flow will slow their rate of shrinkage, and that companies with growing free cash flow will see their growth rate slow, over this period. We do this to reflect that growth tends to slow more in the early years than it does in later years.
Generally we assume that a dollar today is more valuable than a dollar in the future, so we need to discount the sum of these future cash flows to arrive at a present value estimate:
10-year free cash flow (FCF) estimate
| 2024 | 2025 | 2026 | 2027 | 2028 | 2029 | 2030 | 2031 | 2032 | 2033 | |
| Levered FCF (₹, Millions) | ₹20.1b | ₹6.47b | ₹9.51b | ₹12.0b | ₹14.5b | ₹16.9b | ₹19.2b | ₹21.4b | ₹23.5b | ₹25.6b |
| Growth Rate Estimate Source | Analyst x2 | Analyst x3 | Analyst x3 | Est @ 26.52% | Est @ 20.57% | Est @ 16.40% | Est @ 13.49% | Est @ 11.45% | Est @ 10.02% | Est @ 9.02% |
| Present Value (₹, Millions) Discounted @ 13% | ₹17.8k | ₹5.1k | ₹6.6k | ₹7.4k | ₹7.9k | ₹8.1k | ₹8.2k | ₹8.1k | ₹7.9k | ₹7.6k |
("Est" = FCF growth rate estimated by Simply Wall St)
Present Value of 10-year Cash Flow (PVCF) = ₹85b
We now need to calculate the Terminal Value, which accounts for all the future cash flows after this ten year period. The Gordon Growth formula is used to calculate Terminal Value at a future annual growth rate equal to the 5-year average of the 10-year government bond yield of 6.7%. We discount the terminal cash flows to today's value at a cost of equity of 13%.
Terminal Value (TV)= FCF2033 × (1 + g) ÷ (r – g) = ₹26b× (1 + 6.7%) ÷ (13%– 6.7%) = ₹438b
Present Value of Terminal Value (PVTV)= TV / (1 + r)10= ₹438b÷ ( 1 + 13%)10= ₹130b
The total value, or equity value, is then the sum of the present value of the future cash flows, which in this case is ₹214b. In the final step we divide the equity value by the number of shares outstanding. Relative to the current share price of ₹1.0k, the company appears potentially overvalued at the time of writing. Remember though, that this is just an approximate valuation, and like any complex formula - garbage in, garbage out.
The Assumptions
Now the most important inputs to a discounted cash flow are the discount rate, and of course, the actual cash flows. Part of investing is coming up with your own evaluation of a company's future performance, so try the calculation yourself and check your own assumptions. The DCF also does not consider the possible cyclicality of an industry, or a company's future capital requirements, so it does not give a full picture of a company's potential performance. Given that we are looking at Glenmark Pharmaceuticals as potential shareholders, the cost of equity is used as the discount rate, rather than the cost of capital (or weighted average cost of capital, WACC) which accounts for debt. In this calculation we've used 13%, which is based on a levered beta of 0.800. Beta is a measure of a stock's volatility, compared to the market as a whole. We get our beta from the industry average beta of globally comparable companies, with an imposed limit between 0.8 and 2.0, which is a reasonable range for a stable business.
SWOT Analysis for Glenmark Pharmaceuticals
- No major strengths identified for GLENMARK.
- Interest payments on debt are not well covered.
- Dividend is low compared to the top 25% of dividend payers in the Pharmaceuticals market.
- Expected to breakeven next year.
- Has sufficient cash runway for more than 3 years based on current free cash flows.
- Good value based on P/S ratio compared to estimated Fair P/S ratio.
- Debt is not well covered by operating cash flow.
- Dividends are not covered by cash flow.
Looking Ahead:
Whilst important, the DCF calculation is only one of many factors that you need to assess for a company. It's not possible to obtain a foolproof valuation with a DCF model. Preferably you'd apply different cases and assumptions and see how they would impact the company's valuation. For instance, if the terminal value growth rate is adjusted slightly, it can dramatically alter the overall result. What is the reason for the share price exceeding the intrinsic value? For Glenmark Pharmaceuticals, we've compiled three essential factors you should further research:
- Risks: We feel that you should assess the 1 warning sign for Glenmark Pharmaceuticals we've flagged before making an investment in the company.
- Future Earnings: How does GLENMARK's growth rate compare to its peers and the wider market? Dig deeper into the analyst consensus number for the upcoming years by interacting with our free analyst growth expectation chart.
- Other High Quality Alternatives: Do you like a good all-rounder? Explore our interactive list of high quality stocks to get an idea of what else is out there you may be missing!
PS. Simply Wall St updates its DCF calculation for every Indian stock every day, so if you want to find the intrinsic value of any other stock just search here.
New: Manage All Your Stock Portfolios in One Place
We've created the ultimate portfolio companion for stock investors, and it's free.
• Connect an unlimited number of Portfolios and see your total in one currency
• Be alerted to new Warning Signs or Risks via email or mobile
• Track the Fair Value of your stocks
Have feedback on this article? Concerned about the content? Get in touch with us directly. Alternatively, email editorial-team (at) simplywallst.com.
This article by Simply Wall St is general in nature. We provide commentary based on historical data and analyst forecasts only using an unbiased methodology and our articles are not intended to be financial advice. It does not constitute a recommendation to buy or sell any stock, and does not take account of your objectives, or your financial situation. We aim to bring you long-term focused analysis driven by fundamental data. Note that our analysis may not factor in the latest price-sensitive company announcements or qualitative material. Simply Wall St has no position in any stocks mentioned.
About NSEI:GLENMARK
Glenmark Pharmaceuticals
Develops, manufactures, and sells generics, specialty products, and OTC pharmaceutical products in India, North America, Latin America, Europe, and internationally.
Excellent balance sheet and fair value.
Similar Companies
Market Insights

Community Narratives
