Biocon Limited's (NSE:BIOCON) Intrinsic Value Is Potentially 18% Below Its Share Price


Key Insights
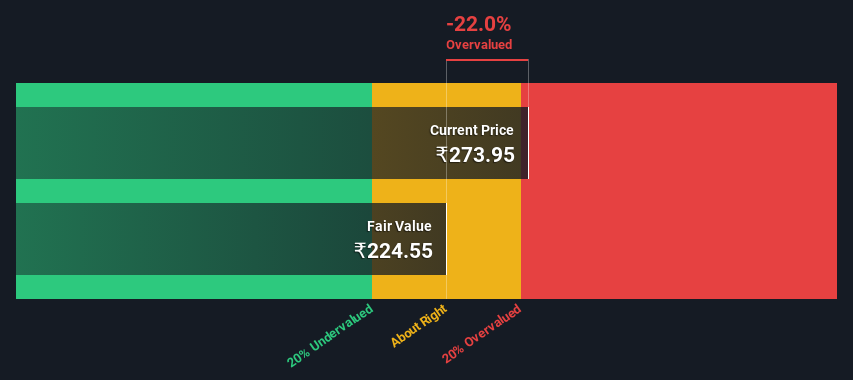
- Using the 2 Stage Free Cash Flow to Equity, Biocon fair value estimate is ₹225
- Biocon's ₹274 share price signals that it might be 22% overvalued
- Our fair value estimate is 21% lower than Biocon's analyst price target of ₹283
Does the January share price for Biocon Limited (NSE:BIOCON) reflect what it's really worth? Today, we will estimate the stock's intrinsic value by taking the forecast future cash flows of the company and discounting them back to today's value. We will take advantage of the Discounted Cash Flow (DCF) model for this purpose. It may sound complicated, but actually it is quite simple!
Remember though, that there are many ways to estimate a company's value, and a DCF is just one method. If you want to learn more about discounted cash flow, the rationale behind this calculation can be read in detail in the Simply Wall St analysis model.
Check out our latest analysis for Biocon
The Calculation
We use what is known as a 2-stage model, which simply means we have two different periods of growth rates for the company's cash flows. Generally the first stage is higher growth, and the second stage is a lower growth phase. To start off with, we need to estimate the next ten years of cash flows. Where possible we use analyst estimates, but when these aren't available we extrapolate the previous free cash flow (FCF) from the last estimate or reported value. We assume companies with shrinking free cash flow will slow their rate of shrinkage, and that companies with growing free cash flow will see their growth rate slow, over this period. We do this to reflect that growth tends to slow more in the early years than it does in later years.
A DCF is all about the idea that a dollar in the future is less valuable than a dollar today, so we discount the value of these future cash flows to their estimated value in today's dollars:
10-year free cash flow (FCF) forecast
| 2024 | 2025 | 2026 | 2027 | 2028 | 2029 | 2030 | 2031 | 2032 | 2033 | |
| Levered FCF (₹, Millions) | ₹11.7b | ₹13.0b | ₹15.0b | ₹21.6b | ₹25.2b | ₹28.6b | ₹31.9b | ₹35.1b | ₹38.3b | ₹41.5b |
| Growth Rate Estimate Source | Analyst x6 | Analyst x6 | Analyst x4 | Analyst x1 | Est @ 16.52% | Est @ 13.58% | Est @ 11.53% | Est @ 10.09% | Est @ 9.08% | Est @ 8.38% |
| Present Value (₹, Millions) Discounted @ 14% | ₹10.2k | ₹10.0k | ₹10.0k | ₹12.6k | ₹12.9k | ₹12.8k | ₹12.5k | ₹12.0k | ₹11.5k | ₹10.9k |
("Est" = FCF growth rate estimated by Simply Wall St)
Present Value of 10-year Cash Flow (PVCF) = ₹115b
The second stage is also known as Terminal Value, this is the business's cash flow after the first stage. The Gordon Growth formula is used to calculate Terminal Value at a future annual growth rate equal to the 5-year average of the 10-year government bond yield of 6.7%. We discount the terminal cash flows to today's value at a cost of equity of 14%.
Terminal Value (TV)= FCF2033 × (1 + g) ÷ (r – g) = ₹42b× (1 + 6.7%) ÷ (14%– 6.7%) = ₹583b
Present Value of Terminal Value (PVTV)= TV / (1 + r)10= ₹583b÷ ( 1 + 14%)10= ₹153b
The total value, or equity value, is then the sum of the present value of the future cash flows, which in this case is ₹268b. To get the intrinsic value per share, we divide this by the total number of shares outstanding. Compared to the current share price of ₹274, the company appears slightly overvalued at the time of writing. Valuations are imprecise instruments though, rather like a telescope - move a few degrees and end up in a different galaxy. Do keep this in mind.
Important Assumptions
We would point out that the most important inputs to a discounted cash flow are the discount rate and of course the actual cash flows. Part of investing is coming up with your own evaluation of a company's future performance, so try the calculation yourself and check your own assumptions. The DCF also does not consider the possible cyclicality of an industry, or a company's future capital requirements, so it does not give a full picture of a company's potential performance. Given that we are looking at Biocon as potential shareholders, the cost of equity is used as the discount rate, rather than the cost of capital (or weighted average cost of capital, WACC) which accounts for debt. In this calculation we've used 14%, which is based on a levered beta of 0.913. Beta is a measure of a stock's volatility, compared to the market as a whole. We get our beta from the industry average beta of globally comparable companies, with an imposed limit between 0.8 and 2.0, which is a reasonable range for a stable business.
SWOT Analysis for Biocon
- No major strengths identified for BIOCON.
- Earnings declined over the past year.
- Interest payments on debt are not well covered.
- Dividend is low compared to the top 25% of dividend payers in the Biotechs market.
- Expensive based on P/E ratio and estimated fair value.
- Annual earnings are forecast to grow faster than the Indian market.
- Debt is not well covered by operating cash flow.
- Paying a dividend but company has no free cash flows.
- Revenue is forecast to grow slower than 20% per year.
Looking Ahead:
Whilst important, the DCF calculation ideally won't be the sole piece of analysis you scrutinize for a company. It's not possible to obtain a foolproof valuation with a DCF model. Instead the best use for a DCF model is to test certain assumptions and theories to see if they would lead to the company being undervalued or overvalued. For example, changes in the company's cost of equity or the risk free rate can significantly impact the valuation. What is the reason for the share price exceeding the intrinsic value? For Biocon, we've compiled three essential items you should further research:
- Risks: We feel that you should assess the 3 warning signs for Biocon (1 shouldn't be ignored!) we've flagged before making an investment in the company.
- Management:Have insiders been ramping up their shares to take advantage of the market's sentiment for BIOCON's future outlook? Check out our management and board analysis with insights on CEO compensation and governance factors.
- Other High Quality Alternatives: Do you like a good all-rounder? Explore our interactive list of high quality stocks to get an idea of what else is out there you may be missing!
PS. Simply Wall St updates its DCF calculation for every Indian stock every day, so if you want to find the intrinsic value of any other stock just search here.
Valuation is complex, but we're here to simplify it.
Discover if Biocon might be undervalued or overvalued with our detailed analysis, featuring fair value estimates, potential risks, dividends, insider trades, and its financial condition.
Access Free AnalysisHave feedback on this article? Concerned about the content? Get in touch with us directly. Alternatively, email editorial-team (at) simplywallst.com.
This article by Simply Wall St is general in nature. We provide commentary based on historical data and analyst forecasts only using an unbiased methodology and our articles are not intended to be financial advice. It does not constitute a recommendation to buy or sell any stock, and does not take account of your objectives, or your financial situation. We aim to bring you long-term focused analysis driven by fundamental data. Note that our analysis may not factor in the latest price-sensitive company announcements or qualitative material. Simply Wall St has no position in any stocks mentioned.
About NSEI:BIOCON
Biocon
Engages in the manufacture and sale of biotechnology products and research services in India, Brazil, Singapore, and internationally.
Reasonable growth potential low.

