Is Abbott India Limited's (NSE:ABBOTINDIA) Recent Performance Tethered To Its Attractive Financial Prospects?


Abbott India's (NSE:ABBOTINDIA) stock is up by 5.1% over the past three months. Given its impressive performance, we decided to study the company's key financial indicators as a company's long-term fundamentals usually dictate market outcomes. Particularly, we will be paying attention to Abbott India's ROE today.
Return on Equity or ROE is a test of how effectively a company is growing its value and managing investors’ money. Simply put, it is used to assess the profitability of a company in relation to its equity capital.
View our latest analysis for Abbott India
How Is ROE Calculated?
Return on equity can be calculated by using the formula:
Return on Equity = Net Profit (from continuing operations) ÷ Shareholders' Equity
So, based on the above formula, the ROE for Abbott India is:
33% = ₹12b ÷ ₹37b (Based on the trailing twelve months to June 2024).
The 'return' refers to a company's earnings over the last year. So, this means that for every ₹1 of its shareholder's investments, the company generates a profit of ₹0.33.
Why Is ROE Important For Earnings Growth?
Thus far, we have learned that ROE measures how efficiently a company is generating its profits. Depending on how much of these profits the company reinvests or "retains", and how effectively it does so, we are then able to assess a company’s earnings growth potential. Assuming all else is equal, companies that have both a higher return on equity and higher profit retention are usually the ones that have a higher growth rate when compared to companies that don't have the same features.
Abbott India's Earnings Growth And 33% ROE
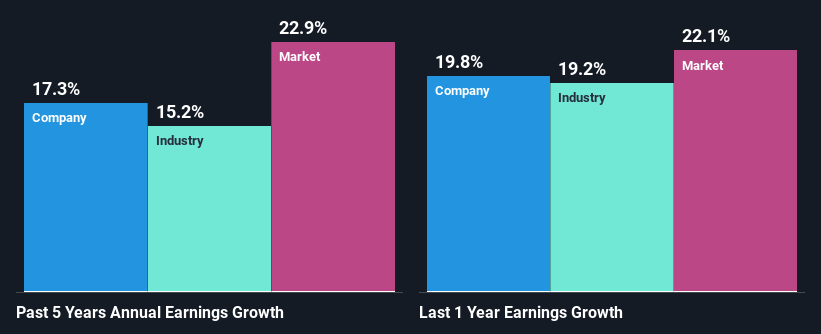
First thing first, we like that Abbott India has an impressive ROE. Secondly, even when compared to the industry average of 12% the company's ROE is quite impressive. This probably laid the groundwork for Abbott India's moderate 17% net income growth seen over the past five years.
As a next step, we compared Abbott India's net income growth with the industry and found that the company has a similar growth figure when compared with the industry average growth rate of 15% in the same period.
Earnings growth is a huge factor in stock valuation. It’s important for an investor to know whether the market has priced in the company's expected earnings growth (or decline). This then helps them determine if the stock is placed for a bright or bleak future. One good indicator of expected earnings growth is the P/E ratio which determines the price the market is willing to pay for a stock based on its earnings prospects. So, you may want to check if Abbott India is trading on a high P/E or a low P/E, relative to its industry.
Is Abbott India Efficiently Re-investing Its Profits?
Abbott India has a healthy combination of a moderate three-year median payout ratio of 40% (or a retention ratio of 60%) and a respectable amount of growth in earnings as we saw above, meaning that the company has been making efficient use of its profits.
Besides, Abbott India has been paying dividends for at least ten years or more. This shows that the company is committed to sharing profits with its shareholders. Upon studying the latest analysts' consensus data, we found that the company's future payout ratio is expected to rise to 58% over the next three years. Despite the higher expected payout ratio, the company's ROE is not expected to change by much.
Conclusion
In total, we are pretty happy with Abbott India's performance. Particularly, we like that the company is reinvesting heavily into its business, and at a high rate of return. Unsurprisingly, this has led to an impressive earnings growth. With that said, the latest industry analyst forecasts reveal that the company's earnings growth is expected to slow down. Are these analysts expectations based on the broad expectations for the industry, or on the company's fundamentals? Click here to be taken to our analyst's forecasts page for the company.
New: Manage All Your Stock Portfolios in One Place
We've created the ultimate portfolio companion for stock investors, and it's free.
• Connect an unlimited number of Portfolios and see your total in one currency
• Be alerted to new Warning Signs or Risks via email or mobile
• Track the Fair Value of your stocks
Have feedback on this article? Concerned about the content? Get in touch with us directly. Alternatively, email editorial-team (at) simplywallst.com.
This article by Simply Wall St is general in nature. We provide commentary based on historical data and analyst forecasts only using an unbiased methodology and our articles are not intended to be financial advice. It does not constitute a recommendation to buy or sell any stock, and does not take account of your objectives, or your financial situation. We aim to bring you long-term focused analysis driven by fundamental data. Note that our analysis may not factor in the latest price-sensitive company announcements or qualitative material. Simply Wall St has no position in any stocks mentioned.
About NSEI:ABBOTINDIA
Flawless balance sheet established dividend payer.
Similar Companies
Market Insights

Community Narratives

