- India
- /
- Paper and Forestry Products
- /
- NSEI:TNPL
Tamil Nadu Newsprint and Papers' (NSE:TNPL) earnings growth rate lags the 40% CAGR delivered to shareholders


It's been a soft week for Tamil Nadu Newsprint and Papers Limited (NSE:TNPL) shares, which are down 11%. But in three years the returns have been great. Indeed, the share price is up a very strong 149% in that time. To some, the recent share price pullback wouldn't be surprising after such a good run. Only time will tell if there is still too much optimism currently reflected in the share price.
Although Tamil Nadu Newsprint and Papers has shed ₹2.0b from its market cap this week, let's take a look at its longer term fundamental trends and see if they've driven returns.
See our latest analysis for Tamil Nadu Newsprint and Papers
To quote Buffett, 'Ships will sail around the world but the Flat Earth Society will flourish. There will continue to be wide discrepancies between price and value in the marketplace...' One imperfect but simple way to consider how the market perception of a company has shifted is to compare the change in the earnings per share (EPS) with the share price movement.
During three years of share price growth, Tamil Nadu Newsprint and Papers achieved compound earnings per share growth of 44% per year. The average annual share price increase of 36% is actually lower than the EPS growth. So one could reasonably conclude that the market has cooled on the stock. We'd venture the lowish P/E ratio of 4.03 also reflects the negative sentiment around the stock.
The graphic below depicts how EPS has changed over time (unveil the exact values by clicking on the image).
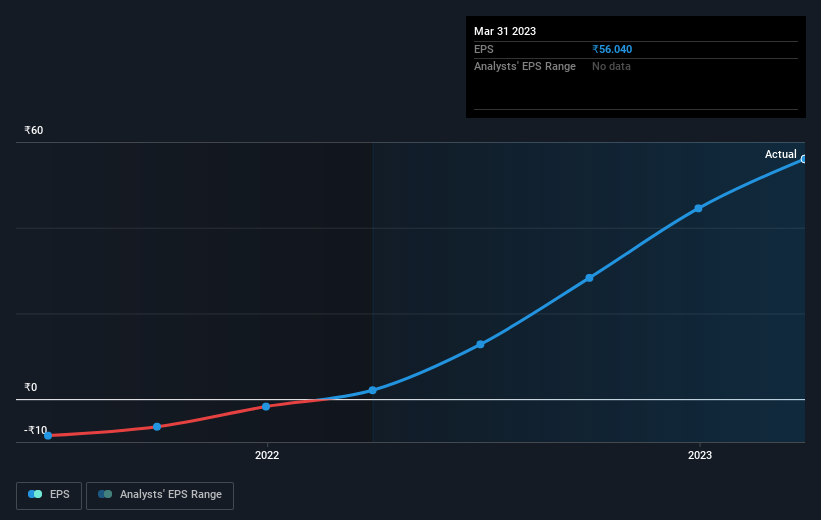
It might be well worthwhile taking a look at our free report on Tamil Nadu Newsprint and Papers' earnings, revenue and cash flow.
What About Dividends?
When looking at investment returns, it is important to consider the difference between total shareholder return (TSR) and share price return. Whereas the share price return only reflects the change in the share price, the TSR includes the value of dividends (assuming they were reinvested) and the benefit of any discounted capital raising or spin-off. Arguably, the TSR gives a more comprehensive picture of the return generated by a stock. We note that for Tamil Nadu Newsprint and Papers the TSR over the last 3 years was 173%, which is better than the share price return mentioned above. And there's no prize for guessing that the dividend payments largely explain the divergence!
A Different Perspective
We're pleased to report that Tamil Nadu Newsprint and Papers shareholders have received a total shareholder return of 33% over one year. And that does include the dividend. There's no doubt those recent returns are much better than the TSR loss of 3% per year over five years. We generally put more weight on the long term performance over the short term, but the recent improvement could hint at a (positive) inflection point within the business. While it is well worth considering the different impacts that market conditions can have on the share price, there are other factors that are even more important. Even so, be aware that Tamil Nadu Newsprint and Papers is showing 2 warning signs in our investment analysis , you should know about...
If you like to buy stocks alongside management, then you might just love this free list of companies. (Hint: insiders have been buying them).
Please note, the market returns quoted in this article reflect the market weighted average returns of stocks that currently trade on Indian exchanges.
If you're looking to trade Tamil Nadu Newsprint and Papers, open an account with the lowest-cost platform trusted by professionals, Interactive Brokers.
With clients in over 200 countries and territories, and access to 160 markets, IBKR lets you trade stocks, options, futures, forex, bonds and funds from a single integrated account.
Enjoy no hidden fees, no account minimums, and FX conversion rates as low as 0.03%, far better than what most brokers offer.
Sponsored ContentValuation is complex, but we're here to simplify it.
Discover if Tamil Nadu Newsprint and Papers might be undervalued or overvalued with our detailed analysis, featuring fair value estimates, potential risks, dividends, insider trades, and its financial condition.
Access Free AnalysisHave feedback on this article? Concerned about the content? Get in touch with us directly. Alternatively, email editorial-team (at) simplywallst.com.
This article by Simply Wall St is general in nature. We provide commentary based on historical data and analyst forecasts only using an unbiased methodology and our articles are not intended to be financial advice. It does not constitute a recommendation to buy or sell any stock, and does not take account of your objectives, or your financial situation. We aim to bring you long-term focused analysis driven by fundamental data. Note that our analysis may not factor in the latest price-sensitive company announcements or qualitative material. Simply Wall St has no position in any stocks mentioned.
About NSEI:TNPL
Tamil Nadu Newsprint and Papers
Manufactures and markets paper and paperboards in India and internationally.
Average dividend payer with mediocre balance sheet.
Similar Companies
Market Insights

Community Narratives

