Be Wary Of Thirumalai Chemicals (NSE:TIRUMALCHM) And Its Returns On Capital


There are a few key trends to look for if we want to identify the next multi-bagger. Ideally, a business will show two trends; firstly a growing return on capital employed (ROCE) and secondly, an increasing amount of capital employed. If you see this, it typically means it's a company with a great business model and plenty of profitable reinvestment opportunities. Having said that, from a first glance at Thirumalai Chemicals (NSE:TIRUMALCHM) we aren't jumping out of our chairs at how returns are trending, but let's have a deeper look.
What is Return On Capital Employed (ROCE)?
If you haven't worked with ROCE before, it measures the 'return' (pre-tax profit) a company generates from capital employed in its business. To calculate this metric for Thirumalai Chemicals, this is the formula:
Return on Capital Employed = Earnings Before Interest and Tax (EBIT) ÷ (Total Assets - Current Liabilities)
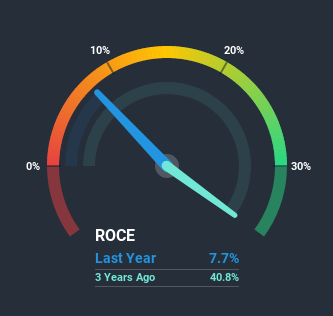
0.077 = ₹711m ÷ (₹12b - ₹2.8b) (Based on the trailing twelve months to December 2020).
Therefore, Thirumalai Chemicals has an ROCE of 7.7%. Ultimately, that's a low return and it under-performs the Chemicals industry average of 15%.
Check out our latest analysis for Thirumalai Chemicals
While the past is not representative of the future, it can be helpful to know how a company has performed historically, which is why we have this chart above. If you're interested in investigating Thirumalai Chemicals' past further, check out this free graph of past earnings, revenue and cash flow.
So How Is Thirumalai Chemicals' ROCE Trending?
When we looked at the ROCE trend at Thirumalai Chemicals, we didn't gain much confidence. Around five years ago the returns on capital were 23%, but since then they've fallen to 7.7%. Given the business is employing more capital while revenue has slipped, this is a bit concerning. This could mean that the business is losing its competitive advantage or market share, because while more money is being put into ventures, it's actually producing a lower return - "less bang for their buck" per se.
On a side note, Thirumalai Chemicals has done well to pay down its current liabilities to 23% of total assets. That could partly explain why the ROCE has dropped. Effectively this means their suppliers or short-term creditors are funding less of the business, which reduces some elements of risk. Some would claim this reduces the business' efficiency at generating ROCE since it is now funding more of the operations with its own money.
What We Can Learn From Thirumalai Chemicals' ROCE
From the above analysis, we find it rather worrisome that returns on capital and sales for Thirumalai Chemicals have fallen, meanwhile the business is employing more capital than it was five years ago. Since the stock has skyrocketed 481% over the last five years, it looks like investors have high expectations of the stock. In any case, the current underlying trends don't bode well for long term performance so unless they reverse, we'd start looking elsewhere.
On a final note, we've found 1 warning sign for Thirumalai Chemicals that we think you should be aware of.
While Thirumalai Chemicals may not currently earn the highest returns, we've compiled a list of companies that currently earn more than 25% return on equity. Check out this free list here.
When trading Thirumalai Chemicals or any other investment, use the platform considered by many to be the Professional's Gateway to the Worlds Market, Interactive Brokers. You get the lowest-cost* trading on stocks, options, futures, forex, bonds and funds worldwide from a single integrated account. Promoted
Valuation is complex, but we're here to simplify it.
Discover if Thirumalai Chemicals might be undervalued or overvalued with our detailed analysis, featuring fair value estimates, potential risks, dividends, insider trades, and its financial condition.
Access Free AnalysisThis article by Simply Wall St is general in nature. It does not constitute a recommendation to buy or sell any stock, and does not take account of your objectives, or your financial situation. We aim to bring you long-term focused analysis driven by fundamental data. Note that our analysis may not factor in the latest price-sensitive company announcements or qualitative material. Simply Wall St has no position in any stocks mentioned.
*Interactive Brokers Rated Lowest Cost Broker by StockBrokers.com Annual Online Review 2020
Have feedback on this article? Concerned about the content? Get in touch with us directly. Alternatively, email editorial-team (at) simplywallst.com.
About NSEI:TIRUMALCHM
Thirumalai Chemicals
Manufactures and sells organic chemicals in India and internationally.
Low unattractive dividend payer.
