
Advertisement
- India
- /
- Metals and Mining
- /
- NSEI:TATASTEEL
Tata Steel (NSE:TATASTEEL) delivers shareholders massive 42% CAGR over 5 years, surging 9.6% in the last week alone

Long term investing can be life changing when you buy and hold the truly great businesses. And highest quality companies can see their share prices grow by huge amounts. To wit, the Tata Steel Limited (NSE:TATASTEEL) share price has soared 400% over five years. This just goes to show the value creation that some businesses can achieve. Better yet, the share price has risen 9.6% in the last week.
Since the stock has added ₹181b to its market cap in the past week alone, let's see if underlying performance has been driving long-term returns.
Check out our latest analysis for Tata Steel
While markets are a powerful pricing mechanism, share prices reflect investor sentiment, not just underlying business performance. One way to examine how market sentiment has changed over time is to look at the interaction between a company's share price and its earnings per share (EPS).
Tata Steel's earnings per share are down 4.4% per year, despite strong share price performance over five years. This was, in part, due to extraordinary items impacting earning in the last twelve months.
By glancing at these numbers, we'd posit that the decline in earnings per share is not representative of how the business has changed over the years. Since the change in EPS doesn't seem to correlate with the change in share price, it's worth taking a look at other metrics.
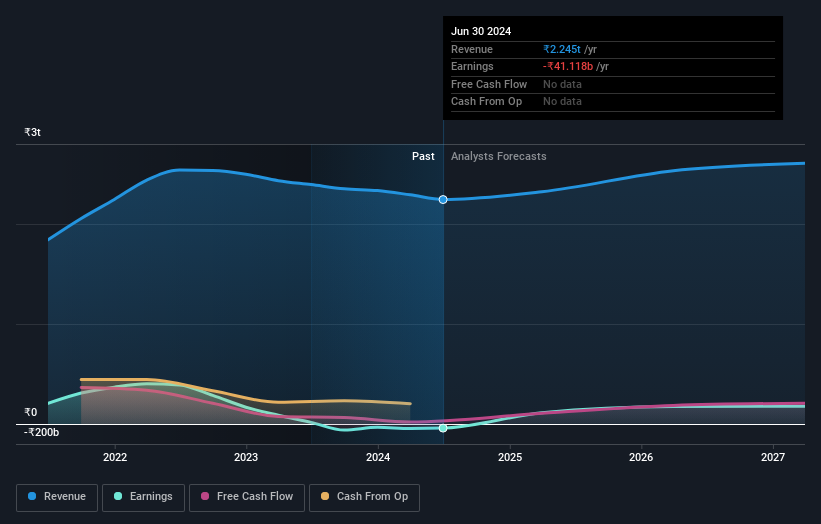
On the other hand, Tata Steel's revenue is growing nicely, at a compound rate of 13% over the last five years. In that case, the company may be sacrificing current earnings per share to drive growth.
You can see below how earnings and revenue have changed over time (discover the exact values by clicking on the image).
Tata Steel is a well known stock, with plenty of analyst coverage, suggesting some visibility into future growth. Given we have quite a good number of analyst forecasts, it might be well worth checking out this free chart depicting consensus estimates.
What About Dividends?
It is important to consider the total shareholder return, as well as the share price return, for any given stock. Whereas the share price return only reflects the change in the share price, the TSR includes the value of dividends (assuming they were reinvested) and the benefit of any discounted capital raising or spin-off. It's fair to say that the TSR gives a more complete picture for stocks that pay a dividend. We note that for Tata Steel the TSR over the last 5 years was 482%, which is better than the share price return mentioned above. And there's no prize for guessing that the dividend payments largely explain the divergence!
A Different Perspective
Tata Steel shareholders gained a total return of 32% during the year. Unfortunately this falls short of the market return. If we look back over five years, the returns are even better, coming in at 42% per year for five years. Maybe the share price is just taking a breather while the business executes on its growth strategy. It's always interesting to track share price performance over the longer term. But to understand Tata Steel better, we need to consider many other factors. For instance, we've identified 3 warning signs for Tata Steel (2 are concerning) that you should be aware of.
For those who like to find winning investments this free list of undervalued companies with recent insider purchasing, could be just the ticket.
Please note, the market returns quoted in this article reflect the market weighted average returns of stocks that currently trade on Indian exchanges.
Valuation is complex, but we're here to simplify it.
Discover if Tata Steel might be undervalued or overvalued with our detailed analysis, featuring fair value estimates, potential risks, dividends, insider trades, and its financial condition.
Access Free AnalysisHave feedback on this article? Concerned about the content? Get in touch with us directly. Alternatively, email editorial-team (at) simplywallst.com.
This article by Simply Wall St is general in nature. We provide commentary based on historical data and analyst forecasts only using an unbiased methodology and our articles are not intended to be financial advice. It does not constitute a recommendation to buy or sell any stock, and does not take account of your objectives, or your financial situation. We aim to bring you long-term focused analysis driven by fundamental data. Note that our analysis may not factor in the latest price-sensitive company announcements or qualitative material. Simply Wall St has no position in any stocks mentioned.
About NSEI:TATASTEEL
Tata Steel
Engages in the manufacture and distribution of steel products in India and internationally.
Average dividend payer with moderate growth potential.
Similar Companies
Market Insights

Advertisement
Community Narratives
WhiteCap Is Positioned To Profit Regardless Of Trump's Policy 
Fair Value CA$22.60|61.6% undervalued
ST
Equity Analyst and Writer
Microsoft's Evolution Will Drive Revenue to New Heights Fueled by AI
Fair Value US$360.00|28.6% overvalued
BR
Community Contributor
A CASE FOR USD$2.50 (CAD$3.44) BY 2028 (A 5-10 BAGGER)
Fair Value CA$3.44|87.5% undervalued
AG
Community Contributor