
Advertisement
- India
- /
- Basic Materials
- /
- NSEI:STARCEMENT
Can Star Cement Limited (NSE:STARCEMENT) Performance Keep Up Given Its Mixed Bag Of Fundamentals?
Star Cement's (NSE:STARCEMENT) stock up by 7.4% over the past three months. However, the company's financials look a bit inconsistent and market outcomes are ultimately driven by long-term fundamentals, meaning that the stock could head in either direction. Particularly, we will be paying attention to Star Cement's ROE today.
Return on equity or ROE is an important factor to be considered by a shareholder because it tells them how effectively their capital is being reinvested. Simply put, it is used to assess the profitability of a company in relation to its equity capital.
See our latest analysis for Star Cement
How Do You Calculate Return On Equity?
Return on equity can be calculated by using the formula:
Return on Equity = Net Profit (from continuing operations) ÷ Shareholders' Equity
So, based on the above formula, the ROE for Star Cement is:
4.9% = ₹1.3b ÷ ₹27b (Based on the trailing twelve months to December 2024).
The 'return' is the income the business earned over the last year. One way to conceptualize this is that for each ₹1 of shareholders' capital it has, the company made ₹0.05 in profit.
What Is The Relationship Between ROE And Earnings Growth?
Thus far, we have learned that ROE measures how efficiently a company is generating its profits. Based on how much of its profits the company chooses to reinvest or "retain", we are then able to evaluate a company's future ability to generate profits. Assuming all else is equal, companies that have both a higher return on equity and higher profit retention are usually the ones that have a higher growth rate when compared to companies that don't have the same features.
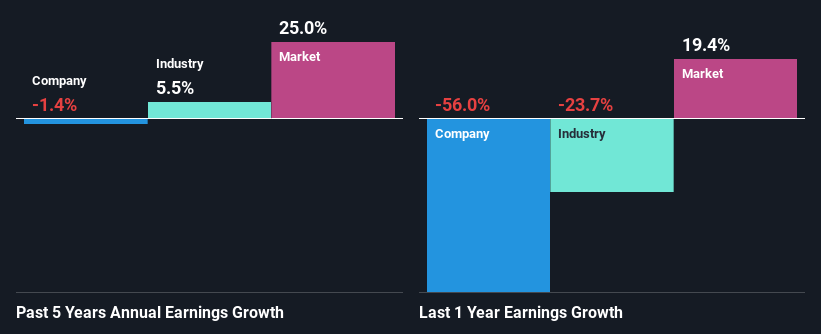
A Side By Side comparison of Star Cement's Earnings Growth And 4.9% ROE
It is quite clear that Star Cement's ROE is rather low. Further, we noted that the company's ROE is similar to the industry average of 5.5%. Thus, the low ROE provides some context to Star Cement's flat net income growth over the past five years.
We then compared Star Cement's net income growth with the industry and found that the average industry growth rate was 5.5% in the same 5-year period.
Earnings growth is an important metric to consider when valuing a stock. It’s important for an investor to know whether the market has priced in the company's expected earnings growth (or decline). This then helps them determine if the stock is placed for a bright or bleak future. What is STARCEMENT worth today? The intrinsic value infographic in our free research report helps visualize whether STARCEMENT is currently mispriced by the market.
Is Star Cement Efficiently Re-investing Its Profits?
Star Cement doesn't pay any regular dividends, meaning that potentially all of its profits are being reinvested in the business. However, this doesn't explain why the company hasn't seen any growth. So there might be other factors at play here which could potentially be hampering growth. For example, the business has faced some headwinds.
Conclusion
In total, we're a bit ambivalent about Star Cement's performance. Even though it appears to be retaining most of its profits, given the low ROE, investors may not be benefitting from all that reinvestment after all. The low earnings growth suggests our theory correct. That being so, the latest industry analyst forecasts show that the analysts are expecting to see a huge improvement in the company's earnings growth rate. To know more about the latest analysts predictions for the company, check out this visualization of analyst forecasts for the company.
New: Manage All Your Stock Portfolios in One Place
We've created the ultimate portfolio companion for stock investors, and it's free.
• Connect an unlimited number of Portfolios and see your total in one currency
• Be alerted to new Warning Signs or Risks via email or mobile
• Track the Fair Value of your stocks
Have feedback on this article? Concerned about the content? Get in touch with us directly. Alternatively, email editorial-team (at) simplywallst.com.
This article by Simply Wall St is general in nature. We provide commentary based on historical data and analyst forecasts only using an unbiased methodology and our articles are not intended to be financial advice. It does not constitute a recommendation to buy or sell any stock, and does not take account of your objectives, or your financial situation. We aim to bring you long-term focused analysis driven by fundamental data. Note that our analysis may not factor in the latest price-sensitive company announcements or qualitative material. Simply Wall St has no position in any stocks mentioned.
About NSEI:STARCEMENT
Star Cement
Manufactures and sells cement and clinker products in India and internationally.
Reasonable growth potential with adequate balance sheet.
Similar Companies
Market Insights

Advertisement
Community Narratives

BMW cruising ahead with new EVs and premium models to boost revenue 5%
Fair Value €135.07|43.5% undervalued
UN
Community Contributor
EU#2 - From Humble Beginnings to Global Powerhouse
Fair Value DKK 851.04|51.3% undervalued
TO
Community Contributor