

David Iben put it well when he said, 'Volatility is not a risk we care about. What we care about is avoiding the permanent loss of capital.' When we think about how risky a company is, we always like to look at its use of debt, since debt overload can lead to ruin. We note that SRF Limited (NSE:SRF) does have debt on its balance sheet. But should shareholders be worried about its use of debt?
When Is Debt A Problem?
Debt and other liabilities become risky for a business when it cannot easily fulfill those obligations, either with free cash flow or by raising capital at an attractive price. Ultimately, if the company can't fulfill its legal obligations to repay debt, shareholders could walk away with nothing. However, a more frequent (but still costly) occurrence is where a company must issue shares at bargain-basement prices, permanently diluting shareholders, just to shore up its balance sheet. Of course, plenty of companies use debt to fund growth, without any negative consequences. The first step when considering a company's debt levels is to consider its cash and debt together.
Check out our latest analysis for SRF
How Much Debt Does SRF Carry?
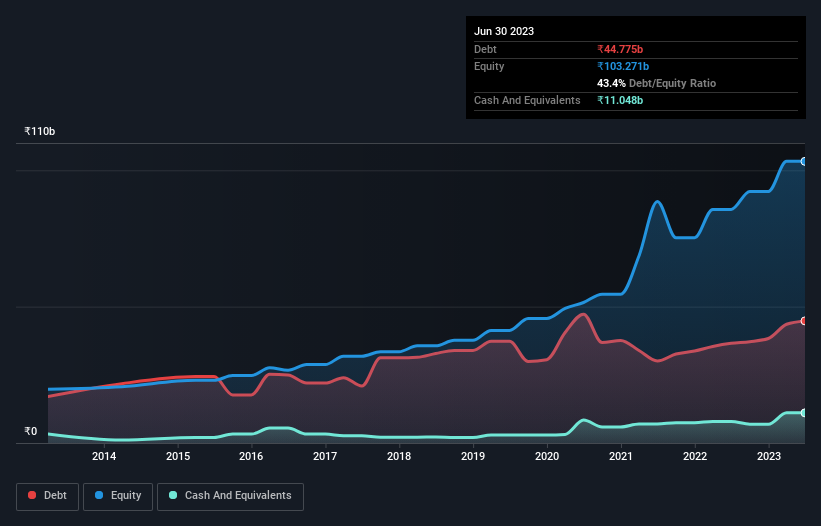
You can click the graphic below for the historical numbers, but it shows that as of March 2023 SRF had ₹44.8b of debt, an increase on ₹36.6b, over one year. However, it does have ₹11.0b in cash offsetting this, leading to net debt of about ₹33.7b.
How Strong Is SRF's Balance Sheet?
The latest balance sheet data shows that SRF had liabilities of ₹49.2b due within a year, and liabilities of ₹35.1b falling due after that. Offsetting these obligations, it had cash of ₹11.0b as well as receivables valued at ₹21.7b due within 12 months. So its liabilities total ₹51.5b more than the combination of its cash and short-term receivables.
Of course, SRF has a market capitalization of ₹703.8b, so these liabilities are probably manageable. However, we do think it is worth keeping an eye on its balance sheet strength, as it may change over time.
In order to size up a company's debt relative to its earnings, we calculate its net debt divided by its earnings before interest, tax, depreciation, and amortization (EBITDA) and its earnings before interest and tax (EBIT) divided by its interest expense (its interest cover). This way, we consider both the absolute quantum of the debt, as well as the interest rates paid on it.
SRF's net debt is only 1.1 times its EBITDA. And its EBIT covers its interest expense a whopping 17.9 times over. So you could argue it is no more threatened by its debt than an elephant is by a mouse. But the bad news is that SRF has seen its EBIT plunge 11% in the last twelve months. If that rate of decline in earnings continues, the company could find itself in a tight spot. When analysing debt levels, the balance sheet is the obvious place to start. But ultimately the future profitability of the business will decide if SRF can strengthen its balance sheet over time. So if you're focused on the future you can check out this free report showing analyst profit forecasts.
But our final consideration is also important, because a company cannot pay debt with paper profits; it needs cold hard cash. So we always check how much of that EBIT is translated into free cash flow. In the last three years, SRF created free cash flow amounting to 9.8% of its EBIT, an uninspiring performance. For us, cash conversion that low sparks a little paranoia about is ability to extinguish debt.
Our View
When it comes to the balance sheet, the standout positive for SRF was the fact that it seems able to cover its interest expense with its EBIT confidently. But the other factors we noted above weren't so encouraging. For example, its conversion of EBIT to free cash flow makes us a little nervous about its debt. When we consider all the factors mentioned above, we do feel a bit cautious about SRF's use of debt. While debt does have its upside in higher potential returns, we think shareholders should definitely consider how debt levels might make the stock more risky. Above most other metrics, we think its important to track how fast earnings per share is growing, if at all. If you've also come to that realization, you're in luck, because today you can view this interactive graph of SRF's earnings per share history for free.
If you're interested in investing in businesses that can grow profits without the burden of debt, then check out this free list of growing businesses that have net cash on the balance sheet.
If you're looking to trade SRF, open an account with the lowest-cost platform trusted by professionals, Interactive Brokers.
With clients in over 200 countries and territories, and access to 160 markets, IBKR lets you trade stocks, options, futures, forex, bonds and funds from a single integrated account.
Enjoy no hidden fees, no account minimums, and FX conversion rates as low as 0.03%, far better than what most brokers offer.
Sponsored ContentNew: Manage All Your Stock Portfolios in One Place
We've created the ultimate portfolio companion for stock investors, and it's free.
• Connect an unlimited number of Portfolios and see your total in one currency
• Be alerted to new Warning Signs or Risks via email or mobile
• Track the Fair Value of your stocks
Have feedback on this article? Concerned about the content? Get in touch with us directly. Alternatively, email editorial-team (at) simplywallst.com.
This article by Simply Wall St is general in nature. We provide commentary based on historical data and analyst forecasts only using an unbiased methodology and our articles are not intended to be financial advice. It does not constitute a recommendation to buy or sell any stock, and does not take account of your objectives, or your financial situation. We aim to bring you long-term focused analysis driven by fundamental data. Note that our analysis may not factor in the latest price-sensitive company announcements or qualitative material. Simply Wall St has no position in any stocks mentioned.
About NSEI:SRF
SRF
Manufactures, purchases, and sells technical textiles, chemicals, packaging films, and other polymers.
Flawless balance sheet with reasonable growth potential.

