
Advertisement
Rain Industries Limited (NSE:RAIN) Soars 27% But It's A Story Of Risk Vs Reward
The Rain Industries Limited (NSE:RAIN) share price has done very well over the last month, posting an excellent gain of 27%. Taking a wider view, although not as strong as the last month, the full year gain of 15% is also fairly reasonable.
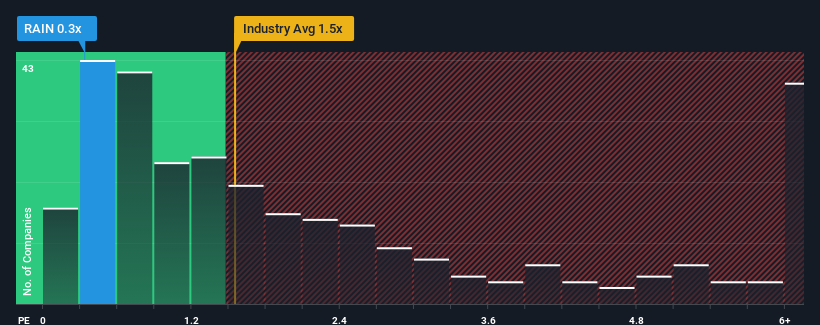
Although its price has surged higher, Rain Industries' price-to-sales (or "P/S") ratio of 0.3x might still make it look like a buy right now compared to the Chemicals industry in India, where around half of the companies have P/S ratios above 1.5x and even P/S above 4x are quite common. However, the P/S might be low for a reason and it requires further investigation to determine if it's justified.
See our latest analysis for Rain Industries
What Does Rain Industries' P/S Mean For Shareholders?
For example, consider that Rain Industries' financial performance has been pretty ordinary lately as revenue growth is non-existent. One possibility is that the P/S is low because investors think this benign revenue growth rate will likely underperform the broader industry in the near future. Those who are bullish on Rain Industries will be hoping that this isn't the case, so that they can pick up the stock at a lower valuation.
Although there are no analyst estimates available for Rain Industries, take a look at this free data-rich visualisation to see how the company stacks up on earnings, revenue and cash flow.What Are Revenue Growth Metrics Telling Us About The Low P/S?
In order to justify its P/S ratio, Rain Industries would need to produce sluggish growth that's trailing the industry.
Taking a look back first, we see that there was hardly any revenue growth to speak of for the company over the past year. Still, the latest three year period has seen an excellent 83% overall rise in revenue, in spite of its uninspiring short-term performance. So while the company has done a solid job in the past, it's somewhat concerning to see revenue growth decline as much as it has.
Comparing that to the industry, which is only predicted to deliver 11% growth in the next 12 months, the company's momentum is stronger based on recent medium-term annualised revenue results.
In light of this, it's peculiar that Rain Industries' P/S sits below the majority of other companies. Apparently some shareholders believe the recent performance has exceeded its limits and have been accepting significantly lower selling prices.
What Does Rain Industries' P/S Mean For Investors?
Despite Rain Industries' share price climbing recently, its P/S still lags most other companies. Generally, our preference is to limit the use of the price-to-sales ratio to establishing what the market thinks about the overall health of a company.
Our examination of Rain Industries revealed its three-year revenue trends aren't boosting its P/S anywhere near as much as we would have predicted, given they look better than current industry expectations. When we see robust revenue growth that outpaces the industry, we presume that there are notable underlying risks to the company's future performance, which is exerting downward pressure on the P/S ratio. While recent revenue trends over the past medium-term suggest that the risk of a price decline is low, investors appear to perceive a likelihood of revenue fluctuations in the future.
Don't forget that there may be other risks. For instance, we've identified 3 warning signs for Rain Industries (1 is concerning) you should be aware of.
If these risks are making you reconsider your opinion on Rain Industries, explore our interactive list of high quality stocks to get an idea of what else is out there.
New: AI Stock Screener & Alerts
Our new AI Stock Screener scans the market every day to uncover opportunities.
• Dividend Powerhouses (3%+ Yield)
• Undervalued Small Caps with Insider Buying
• High growth Tech and AI Companies
Or build your own from over 50 metrics.
Have feedback on this article? Concerned about the content? Get in touch with us directly. Alternatively, email editorial-team (at) simplywallst.com.
This article by Simply Wall St is general in nature. We provide commentary based on historical data and analyst forecasts only using an unbiased methodology and our articles are not intended to be financial advice. It does not constitute a recommendation to buy or sell any stock, and does not take account of your objectives, or your financial situation. We aim to bring you long-term focused analysis driven by fundamental data. Note that our analysis may not factor in the latest price-sensitive company announcements or qualitative material. Simply Wall St has no position in any stocks mentioned.
About NSEI:RAIN
Rain Industries
Manufactures and sells carbon, advanced materials, and cement products in India and internationally.
Low risk and slightly overvalued.
Similar Companies
Market Insights

Advertisement
Community Narratives
Kodiak AI - a potential 100 bagger opportunity?
Fair Value US$14.00|44.7% undervalued
DA
Community Contributor
A Fair Price for a Great Business Facing Real Threats
Fair Value US$383.06|13.0% undervalued
IM
Community Contributor
AXON And Shopify Integration Will Unlock Global Mobile Advertising
Fair Value US$646.30|7.3% undervalued
AN
Based on Analyst Price Targets