
Advertisement
Lacklustre Performance Is Driving Prolife Industries Limited's (NSE:PROLIFE) 25% Price Drop

Unfortunately for some shareholders, the Prolife Industries Limited (NSE:PROLIFE) share price has dived 25% in the last thirty days, prolonging recent pain. Instead of being rewarded, shareholders who have already held through the last twelve months are now sitting on a 25% share price drop.
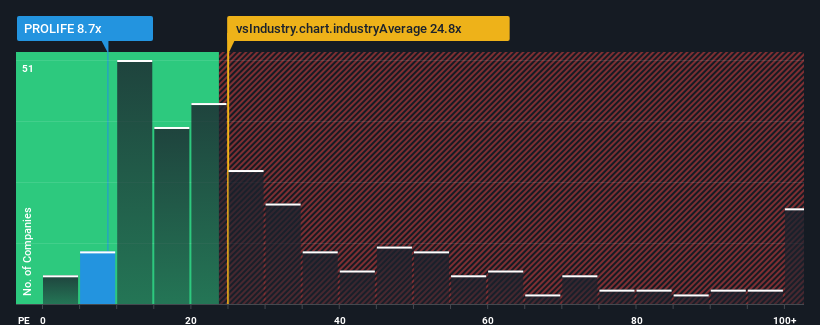
Although its price has dipped substantially, Prolife Industries' price-to-earnings (or "P/E") ratio of 8.7x might still make it look like a strong buy right now compared to the market in India, where around half of the companies have P/E ratios above 27x and even P/E's above 51x are quite common. Although, it's not wise to just take the P/E at face value as there may be an explanation why it's so limited.
Our free stock report includes 3 warning signs investors should be aware of before investing in Prolife Industries. Read for free now.As an illustration, earnings have deteriorated at Prolife Industries over the last year, which is not ideal at all. It might be that many expect the disappointing earnings performance to continue or accelerate, which has repressed the P/E. If you like the company, you'd be hoping this isn't the case so that you could potentially pick up some stock while it's out of favour.
See our latest analysis for Prolife Industries
How Is Prolife Industries' Growth Trending?
There's an inherent assumption that a company should far underperform the market for P/E ratios like Prolife Industries' to be considered reasonable.
Taking a look back first, the company's earnings per share growth last year wasn't something to get excited about as it posted a disappointing decline of 10%. Still, the latest three year period has seen an excellent 34% overall rise in EPS, in spite of its unsatisfying short-term performance. So we can start by confirming that the company has generally done a very good job of growing earnings over that time, even though it had some hiccups along the way.
Comparing that to the market, which is predicted to deliver 24% growth in the next 12 months, the company's momentum is weaker based on recent medium-term annualised earnings results.
With this information, we can see why Prolife Industries is trading at a P/E lower than the market. It seems most investors are expecting to see the recent limited growth rates continue into the future and are only willing to pay a reduced amount for the stock.
The Key Takeaway
Prolife Industries' P/E looks about as weak as its stock price lately. It's argued the price-to-earnings ratio is an inferior measure of value within certain industries, but it can be a powerful business sentiment indicator.
As we suspected, our examination of Prolife Industries revealed its three-year earnings trends are contributing to its low P/E, given they look worse than current market expectations. Right now shareholders are accepting the low P/E as they concede future earnings probably won't provide any pleasant surprises. If recent medium-term earnings trends continue, it's hard to see the share price rising strongly in the near future under these circumstances.
There are also other vital risk factors to consider and we've discovered 3 warning signs for Prolife Industries (2 are a bit unpleasant!) that you should be aware of before investing here.
If P/E ratios interest you, you may wish to see this free collection of other companies with strong earnings growth and low P/E ratios.
New: Manage All Your Stock Portfolios in One Place
We've created the ultimate portfolio companion for stock investors, and it's free.
• Connect an unlimited number of Portfolios and see your total in one currency
• Be alerted to new Warning Signs or Risks via email or mobile
• Track the Fair Value of your stocks
Have feedback on this article? Concerned about the content? Get in touch with us directly. Alternatively, email editorial-team (at) simplywallst.com.
This article by Simply Wall St is general in nature. We provide commentary based on historical data and analyst forecasts only using an unbiased methodology and our articles are not intended to be financial advice. It does not constitute a recommendation to buy or sell any stock, and does not take account of your objectives, or your financial situation. We aim to bring you long-term focused analysis driven by fundamental data. Note that our analysis may not factor in the latest price-sensitive company announcements or qualitative material. Simply Wall St has no position in any stocks mentioned.
About NSEI:PROLIFE
Prolife Industries
Manufactures and sells naphthalene-based intermediates for dyes, pigments, pharmaceuticals, agrochemicals, and others in India and internationally.
Flawless balance sheet low.
Market Insights

Advertisement
Community Narratives

Apple: A Dying Star with an Overpriced Valuation
Fair Value US$177.34|20.1% overvalued
IN
Community Contributor
Avino a case for USD$20 per share within 5 years (assuming $3,500 gold, $100 silver and $4 copper).
Fair Value CA$26.79|87.5% undervalued
AG
Community Contributor
Riding the Defense Boom RENK Sees Revenue Climb at 15% CAGR by FY 2029
Fair Value €69.87|20.5% undervalued
CH
Community Contributor