
Advertisement
- India
- /
- Basic Materials
- /
- NSEI:NCLIND
NCL Industries' (NSE:NCLIND) underlying earnings growth outpaced the notable return generated for shareholders over the past three years
NCL Industries Limited (NSE:NCLIND) shareholders might be concerned after seeing the share price drop 17% in the last month. In contrast the stock is up over the last three years. Arguably you'd have been better off buying an index fund, because the gain of 25% in three years isn't amazing.
Although NCL Industries has shed ₹841m from its market cap this week, let's take a look at its longer term fundamental trends and see if they've driven returns.
View our latest analysis for NCL Industries
To quote Buffett, 'Ships will sail around the world but the Flat Earth Society will flourish. There will continue to be wide discrepancies between price and value in the marketplace...' One way to examine how market sentiment has changed over time is to look at the interaction between a company's share price and its earnings per share (EPS).
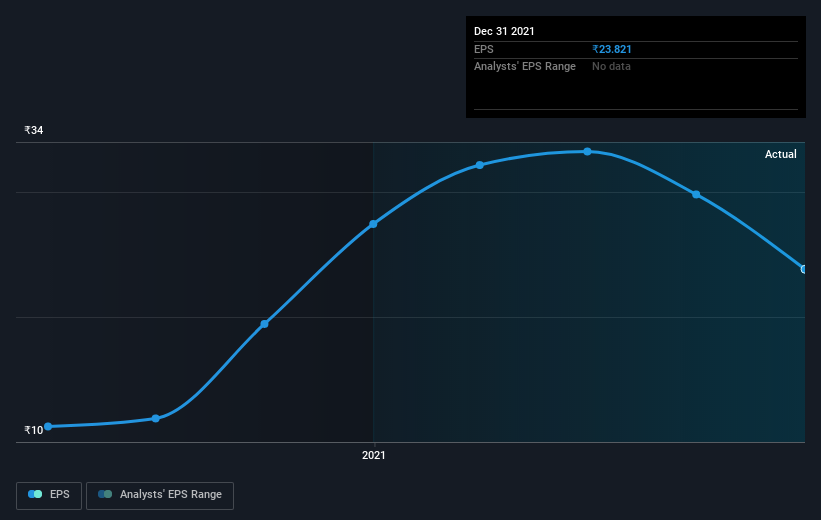
NCL Industries was able to grow its EPS at 53% per year over three years, sending the share price higher. The average annual share price increase of 8% is actually lower than the EPS growth. Therefore, it seems the market has moderated its expectations for growth, somewhat. This cautious sentiment is reflected in its (fairly low) P/E ratio of 6.95.
The company's earnings per share (over time) is depicted in the image below (click to see the exact numbers).
It's probably worth noting we've seen significant insider buying in the last quarter, which we consider a positive. That said, we think earnings and revenue growth trends are even more important factors to consider. It might be well worthwhile taking a look at our free report on NCL Industries' earnings, revenue and cash flow.
What About Dividends?
As well as measuring the share price return, investors should also consider the total shareholder return (TSR). Whereas the share price return only reflects the change in the share price, the TSR includes the value of dividends (assuming they were reinvested) and the benefit of any discounted capital raising or spin-off. It's fair to say that the TSR gives a more complete picture for stocks that pay a dividend. As it happens, NCL Industries' TSR for the last 3 years was 36%, which exceeds the share price return mentioned earlier. And there's no prize for guessing that the dividend payments largely explain the divergence!
A Different Perspective
Investors in NCL Industries had a tough year, with a total loss of 11% (including dividends), against a market gain of about 13%. However, keep in mind that even the best stocks will sometimes underperform the market over a twelve month period. Unfortunately, last year's performance may indicate unresolved challenges, given that it was worse than the annualised loss of 3% over the last half decade. Generally speaking long term share price weakness can be a bad sign, though contrarian investors might want to research the stock in hope of a turnaround. While it is well worth considering the different impacts that market conditions can have on the share price, there are other factors that are even more important. For example, we've discovered 4 warning signs for NCL Industries that you should be aware of before investing here.
There are plenty of other companies that have insiders buying up shares. You probably do not want to miss this free list of growing companies that insiders are buying.
Please note, the market returns quoted in this article reflect the market weighted average returns of stocks that currently trade on IN exchanges.
Valuation is complex, but we're here to simplify it.
Discover if NCL Industries might be undervalued or overvalued with our detailed analysis, featuring fair value estimates, potential risks, dividends, insider trades, and its financial condition.
Access Free AnalysisHave feedback on this article? Concerned about the content? Get in touch with us directly. Alternatively, email editorial-team (at) simplywallst.com.
This article by Simply Wall St is general in nature. We provide commentary based on historical data and analyst forecasts only using an unbiased methodology and our articles are not intended to be financial advice. It does not constitute a recommendation to buy or sell any stock, and does not take account of your objectives, or your financial situation. We aim to bring you long-term focused analysis driven by fundamental data. Note that our analysis may not factor in the latest price-sensitive company announcements or qualitative material. Simply Wall St has no position in any stocks mentioned.
About NSEI:NCLIND
Flawless balance sheet average dividend payer.
Similar Companies
Market Insights

Advertisement
Community Narratives
Finding The True Value Of A Logistics Powerhouse
Fair Value US$95.21|8.7% undervalued
NV
Community Contributor
Paradigm Biopharmaceuticals Will Lead Osteoarthritis Treatment with Zilosul's FDA Success
Fair Value AU$5.50|93.3% undervalued
AM
Community Contributor
Barrick Mining (ABX:CA): A Gold Hedge against a U.S. Shutdown
Fair Value CA$60.00|18.7% undervalued
GM
Community Contributor