- India
- /
- Metals and Mining
- /
- NSEI:NATIONALUM
National Aluminium Company Limited's (NSE:NATIONALUM) Intrinsic Value Is Potentially 35% Above Its Share Price

Key Insights
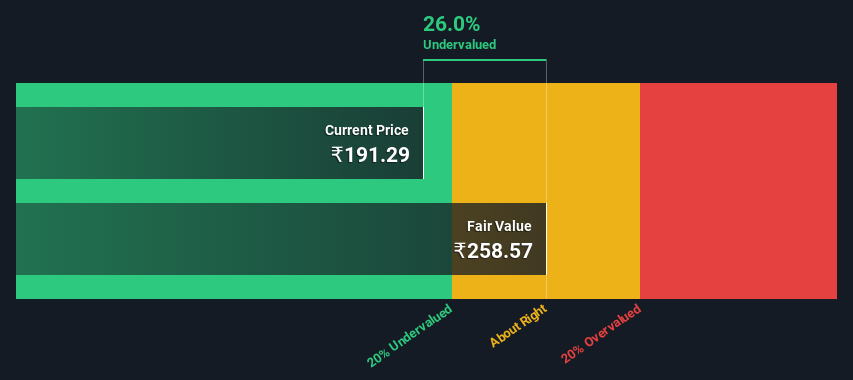
- Using the 2 Stage Free Cash Flow to Equity, National Aluminium fair value estimate is ₹259
- Current share price of ₹191 suggests National Aluminium is potentially 26% undervalued
- The ₹178 analyst price target for NATIONALUM is 31% less than our estimate of fair value
Today we will run through one way of estimating the intrinsic value of National Aluminium Company Limited (NSE:NATIONALUM) by taking the expected future cash flows and discounting them to their present value. Our analysis will employ the Discounted Cash Flow (DCF) model. Before you think you won't be able to understand it, just read on! It's actually much less complex than you'd imagine.
Remember though, that there are many ways to estimate a company's value, and a DCF is just one method. If you still have some burning questions about this type of valuation, take a look at the Simply Wall St analysis model.
See our latest analysis for National Aluminium
Step By Step Through The Calculation
We're using the 2-stage growth model, which simply means we take in account two stages of company's growth. In the initial period the company may have a higher growth rate and the second stage is usually assumed to have a stable growth rate. To start off with, we need to estimate the next ten years of cash flows. Where possible we use analyst estimates, but when these aren't available we extrapolate the previous free cash flow (FCF) from the last estimate or reported value. We assume companies with shrinking free cash flow will slow their rate of shrinkage, and that companies with growing free cash flow will see their growth rate slow, over this period. We do this to reflect that growth tends to slow more in the early years than it does in later years.
A DCF is all about the idea that a dollar in the future is less valuable than a dollar today, so we discount the value of these future cash flows to their estimated value in today's dollars:
10-year free cash flow (FCF) estimate
| 2024 | 2025 | 2026 | 2027 | 2028 | 2029 | 2030 | 2031 | 2032 | 2033 | |
| Levered FCF (₹, Millions) | ₹10.9b | ₹9.70b | ₹22.0b | ₹32.2b | ₹43.4b | ₹54.8b | ₹65.9b | ₹76.7b | ₹86.9b | ₹96.8b |
| Growth Rate Estimate Source | Analyst x4 | Analyst x3 | Analyst x2 | Est @ 46.66% | Est @ 34.67% | Est @ 26.27% | Est @ 20.40% | Est @ 16.29% | Est @ 13.41% | Est @ 11.39% |
| Present Value (₹, Millions) Discounted @ 15% | ₹9.4k | ₹7.3k | ₹14.3k | ₹18.2k | ₹21.2k | ₹23.2k | ₹24.2k | ₹24.4k | ₹24.0k | ₹23.2k |
("Est" = FCF growth rate estimated by Simply Wall St)
Present Value of 10-year Cash Flow (PVCF) = ₹190b
The second stage is also known as Terminal Value, this is the business's cash flow after the first stage. The Gordon Growth formula is used to calculate Terminal Value at a future annual growth rate equal to the 5-year average of the 10-year government bond yield of 6.7%. We discount the terminal cash flows to today's value at a cost of equity of 15%.
Terminal Value (TV)= FCF2033 × (1 + g) ÷ (r – g) = ₹97b× (1 + 6.7%) ÷ (15%– 6.7%) = ₹1.2t
Present Value of Terminal Value (PVTV)= TV / (1 + r)10= ₹1.2t÷ ( 1 + 15%)10= ₹285b
The total value, or equity value, is then the sum of the present value of the future cash flows, which in this case is ₹475b. To get the intrinsic value per share, we divide this by the total number of shares outstanding. Compared to the current share price of ₹191, the company appears a touch undervalued at a 26% discount to where the stock price trades currently. Remember though, that this is just an approximate valuation, and like any complex formula - garbage in, garbage out.
Important Assumptions
Now the most important inputs to a discounted cash flow are the discount rate, and of course, the actual cash flows. You don't have to agree with these inputs, I recommend redoing the calculations yourself and playing with them. The DCF also does not consider the possible cyclicality of an industry, or a company's future capital requirements, so it does not give a full picture of a company's potential performance. Given that we are looking at National Aluminium as potential shareholders, the cost of equity is used as the discount rate, rather than the cost of capital (or weighted average cost of capital, WACC) which accounts for debt. In this calculation we've used 15%, which is based on a levered beta of 1.110. Beta is a measure of a stock's volatility, compared to the market as a whole. We get our beta from the industry average beta of globally comparable companies, with an imposed limit between 0.8 and 2.0, which is a reasonable range for a stable business.
SWOT Analysis for National Aluminium
- Earnings growth over the past year exceeded the industry.
- Debt is not viewed as a risk.
- Dividends are covered by earnings and cash flows.
- Dividend is in the top 25% of dividend payers in the market.
- No major weaknesses identified for NATIONALUM.
- Annual earnings are forecast to grow faster than the Indian market.
- Good value based on P/E ratio and estimated fair value.
- Annual revenue is forecast to grow slower than the Indian market.
Looking Ahead:
Valuation is only one side of the coin in terms of building your investment thesis, and it ideally won't be the sole piece of analysis you scrutinize for a company. The DCF model is not a perfect stock valuation tool. Rather it should be seen as a guide to "what assumptions need to be true for this stock to be under/overvalued?" For instance, if the terminal value growth rate is adjusted slightly, it can dramatically alter the overall result. Why is the intrinsic value higher than the current share price? For National Aluminium, there are three important items you should consider:
- Risks: We feel that you should assess the 2 warning signs for National Aluminium we've flagged before making an investment in the company.
- Future Earnings: How does NATIONALUM's growth rate compare to its peers and the wider market? Dig deeper into the analyst consensus number for the upcoming years by interacting with our free analyst growth expectation chart.
- Other Solid Businesses: Low debt, high returns on equity and good past performance are fundamental to a strong business. Why not explore our interactive list of stocks with solid business fundamentals to see if there are other companies you may not have considered!
PS. Simply Wall St updates its DCF calculation for every Indian stock every day, so if you want to find the intrinsic value of any other stock just search here.
Valuation is complex, but we're here to simplify it.
Discover if National Aluminium might be undervalued or overvalued with our detailed analysis, featuring fair value estimates, potential risks, dividends, insider trades, and its financial condition.
Access Free AnalysisHave feedback on this article? Concerned about the content? Get in touch with us directly. Alternatively, email editorial-team (at) simplywallst.com.
This article by Simply Wall St is general in nature. We provide commentary based on historical data and analyst forecasts only using an unbiased methodology and our articles are not intended to be financial advice. It does not constitute a recommendation to buy or sell any stock, and does not take account of your objectives, or your financial situation. We aim to bring you long-term focused analysis driven by fundamental data. Note that our analysis may not factor in the latest price-sensitive company announcements or qualitative material. Simply Wall St has no position in any stocks mentioned.
Have feedback on this article? Concerned about the content? Get in touch with us directly. Alternatively, email editorial-team@simplywallst.com
About NSEI:NATIONALUM
National Aluminium
Engages in the manufacture and sale of alumina and aluminum products in India and internationally.
Outstanding track record with flawless balance sheet and pays a dividend.
Similar Companies
Market Insights

Community Narratives


