Here's Why Kanoria Chemicals & Industries (NSE:KANORICHEM) Has A Meaningful Debt Burden


Legendary fund manager Li Lu (who Charlie Munger backed) once said, 'The biggest investment risk is not the volatility of prices, but whether you will suffer a permanent loss of capital.' So it might be obvious that you need to consider debt, when you think about how risky any given stock is, because too much debt can sink a company. Importantly, Kanoria Chemicals & Industries Limited (NSE:KANORICHEM) does carry debt. But should shareholders be worried about its use of debt?
What Risk Does Debt Bring?
Generally speaking, debt only becomes a real problem when a company can't easily pay it off, either by raising capital or with its own cash flow. In the worst case scenario, a company can go bankrupt if it cannot pay its creditors. However, a more usual (but still expensive) situation is where a company must dilute shareholders at a cheap share price simply to get debt under control. Of course, the upside of debt is that it often represents cheap capital, especially when it replaces dilution in a company with the ability to reinvest at high rates of return. The first thing to do when considering how much debt a business uses is to look at its cash and debt together.
See our latest analysis for Kanoria Chemicals & Industries
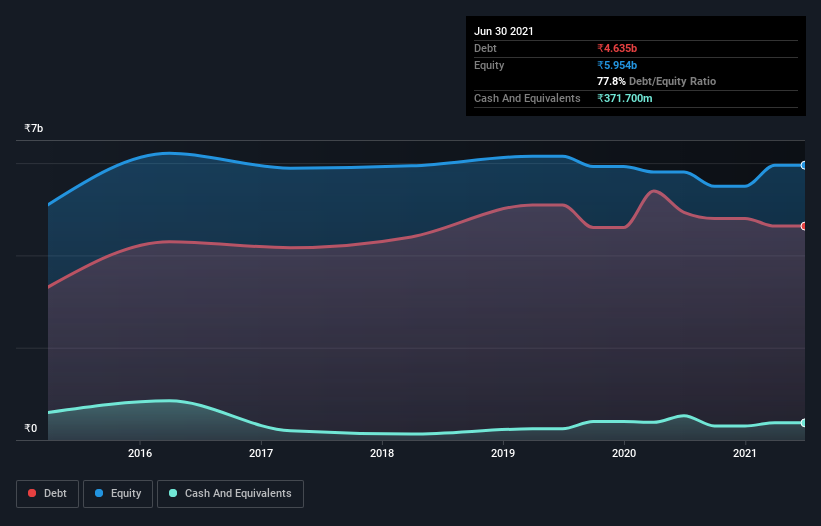
How Much Debt Does Kanoria Chemicals & Industries Carry?
As you can see below, Kanoria Chemicals & Industries had ₹4.63b of debt at March 2021, down from ₹4.93b a year prior. On the flip side, it has ₹371.7m in cash leading to net debt of about ₹4.26b.
How Healthy Is Kanoria Chemicals & Industries' Balance Sheet?
Zooming in on the latest balance sheet data, we can see that Kanoria Chemicals & Industries had liabilities of ₹3.75b due within 12 months and liabilities of ₹3.91b due beyond that. Offsetting this, it had ₹371.7m in cash and ₹2.03b in receivables that were due within 12 months. So it has liabilities totalling ₹5.26b more than its cash and near-term receivables, combined.
This is a mountain of leverage relative to its market capitalization of ₹6.06b. Should its lenders demand that it shore up the balance sheet, shareholders would likely face severe dilution.
In order to size up a company's debt relative to its earnings, we calculate its net debt divided by its earnings before interest, tax, depreciation, and amortization (EBITDA) and its earnings before interest and tax (EBIT) divided by its interest expense (its interest cover). The advantage of this approach is that we take into account both the absolute quantum of debt (with net debt to EBITDA) and the actual interest expenses associated with that debt (with its interest cover ratio).
While we wouldn't worry about Kanoria Chemicals & Industries's net debt to EBITDA ratio of 3.6, we think its super-low interest cover of 2.0 times is a sign of high leverage. It seems that the business incurs large depreciation and amortisation charges, so maybe its debt load is heavier than it would first appear, since EBITDA is arguably a generous measure of earnings. It seems clear that the cost of borrowing money is negatively impacting returns for shareholders, of late. One redeeming factor for Kanoria Chemicals & Industries is that it turned last year's EBIT loss into a gain of ₹592m, over the last twelve months. When analysing debt levels, the balance sheet is the obvious place to start. But you can't view debt in total isolation; since Kanoria Chemicals & Industries will need earnings to service that debt. So when considering debt, it's definitely worth looking at the earnings trend. Click here for an interactive snapshot.
Finally, while the tax-man may adore accounting profits, lenders only accept cold hard cash. So it's worth checking how much of the earnings before interest and tax (EBIT) is backed by free cash flow. During the last year, Kanoria Chemicals & Industries generated free cash flow amounting to a very robust 93% of its EBIT, more than we'd expect. That positions it well to pay down debt if desirable to do so.
Our View
Kanoria Chemicals & Industries's interest cover and level of total liabilities definitely weigh on it, in our esteem. But its conversion of EBIT to free cash flow tells a very different story, and suggests some resilience. Looking at all the angles mentioned above, it does seem to us that Kanoria Chemicals & Industries is a somewhat risky investment as a result of its debt. That's not necessarily a bad thing, since leverage can boost returns on equity, but it is something to be aware of. When analysing debt levels, the balance sheet is the obvious place to start. But ultimately, every company can contain risks that exist outside of the balance sheet. We've identified 3 warning signs with Kanoria Chemicals & Industries (at least 1 which is a bit unpleasant) , and understanding them should be part of your investment process.
If, after all that, you're more interested in a fast growing company with a rock-solid balance sheet, then check out our list of net cash growth stocks without delay.
If you’re looking to trade Kanoria Chemicals & Industries, open an account with the lowest-cost* platform trusted by professionals, Interactive Brokers. Their clients from over 200 countries and territories trade stocks, options, futures, forex, bonds and funds worldwide from a single integrated account. Promoted
If you're looking to trade Kanoria Chemicals & Industries, open an account with the lowest-cost platform trusted by professionals, Interactive Brokers.
With clients in over 200 countries and territories, and access to 160 markets, IBKR lets you trade stocks, options, futures, forex, bonds and funds from a single integrated account.
Enjoy no hidden fees, no account minimums, and FX conversion rates as low as 0.03%, far better than what most brokers offer.
Sponsored ContentValuation is complex, but we're here to simplify it.
Discover if Kanoria Chemicals & Industries might be undervalued or overvalued with our detailed analysis, featuring fair value estimates, potential risks, dividends, insider trades, and its financial condition.
Access Free AnalysisThis article by Simply Wall St is general in nature. We provide commentary based on historical data and analyst forecasts only using an unbiased methodology and our articles are not intended to be financial advice. It does not constitute a recommendation to buy or sell any stock, and does not take account of your objectives, or your financial situation. We aim to bring you long-term focused analysis driven by fundamental data. Note that our analysis may not factor in the latest price-sensitive company announcements or qualitative material. Simply Wall St has no position in any stocks mentioned.
*Interactive Brokers Rated Lowest Cost Broker by StockBrokers.com Annual Online Review 2020
Have feedback on this article? Concerned about the content? Get in touch with us directly. Alternatively, email editorial-team (at) simplywallst.com.
About NSEI:KANORICHEM
Kanoria Chemicals & Industries
Engages in the manufacture and sale of chemical intermediates and specialties in India.
Low and slightly overvalued.

