- India
- /
- Metals and Mining
- /
- NSEI:JSWSTEEL
Is JSW Steel Limited (NSE:JSWSTEEL) Expensive For A Reason? A Look At Its Intrinsic Value


Key Insights
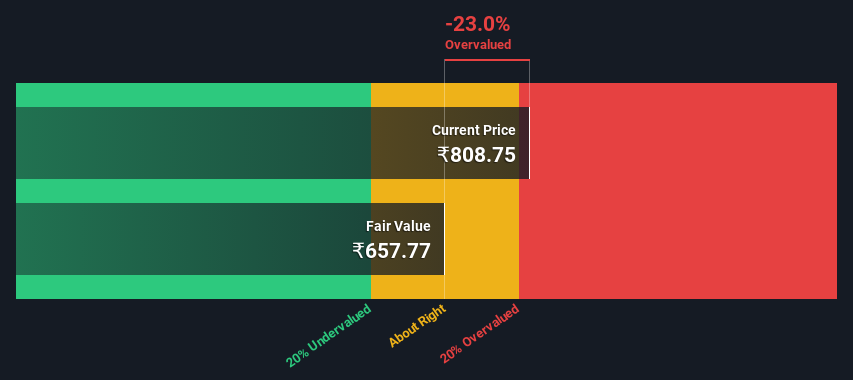
- Using the 2 Stage Free Cash Flow to Equity, JSW Steel fair value estimate is ₹658
- JSW Steel is estimated to be 23% overvalued based on current share price of ₹809
- Analyst price target for JSWSTEEL is ₹833, which is 27% above our fair value estimate
In this article we are going to estimate the intrinsic value of JSW Steel Limited (NSE:JSWSTEEL) by taking the expected future cash flows and discounting them to their present value. One way to achieve this is by employing the Discounted Cash Flow (DCF) model. It may sound complicated, but actually it is quite simple!
We would caution that there are many ways of valuing a company and, like the DCF, each technique has advantages and disadvantages in certain scenarios. If you still have some burning questions about this type of valuation, take a look at the Simply Wall St analysis model.
Check out our latest analysis for JSW Steel
What's The Estimated Valuation?
We are going to use a two-stage DCF model, which, as the name states, takes into account two stages of growth. The first stage is generally a higher growth period which levels off heading towards the terminal value, captured in the second 'steady growth' period. To start off with, we need to estimate the next ten years of cash flows. Where possible we use analyst estimates, but when these aren't available we extrapolate the previous free cash flow (FCF) from the last estimate or reported value. We assume companies with shrinking free cash flow will slow their rate of shrinkage, and that companies with growing free cash flow will see their growth rate slow, over this period. We do this to reflect that growth tends to slow more in the early years than it does in later years.
A DCF is all about the idea that a dollar in the future is less valuable than a dollar today, and so the sum of these future cash flows is then discounted to today's value:
10-year free cash flow (FCF) forecast
| 2024 | 2025 | 2026 | 2027 | 2028 | 2029 | 2030 | 2031 | 2032 | 2033 | |
| Levered FCF (₹, Millions) | ₹16.8b | ₹85.5b | ₹132.0b | ₹171.1b | ₹210.0b | ₹247.7b | ₹283.7b | ₹318.4b | ₹352.0b | ₹385.1b |
| Growth Rate Estimate Source | Analyst x12 | Analyst x13 | Analyst x13 | Est @ 29.60% | Est @ 22.73% | Est @ 17.93% | Est @ 14.56% | Est @ 12.21% | Est @ 10.56% | Est @ 9.40% |
| Present Value (₹, Millions) Discounted @ 17% | ₹14.4k | ₹62.3k | ₹82.2k | ₹90.9k | ₹95.3k | ₹95.9k | ₹93.8k | ₹89.9k | ₹84.8k | ₹79.2k |
("Est" = FCF growth rate estimated by Simply Wall St)
Present Value of 10-year Cash Flow (PVCF) = ₹789b
The second stage is also known as Terminal Value, this is the business's cash flow after the first stage. The Gordon Growth formula is used to calculate Terminal Value at a future annual growth rate equal to the 5-year average of the 10-year government bond yield of 6.7%. We discount the terminal cash flows to today's value at a cost of equity of 17%.
Terminal Value (TV)= FCF2033 × (1 + g) ÷ (r – g) = ₹385b× (1 + 6.7%) ÷ (17%– 6.7%) = ₹3.9t
Present Value of Terminal Value (PVTV)= TV / (1 + r)10= ₹3.9t÷ ( 1 + 17%)10= ₹811b
The total value is the sum of cash flows for the next ten years plus the discounted terminal value, which results in the Total Equity Value, which in this case is ₹1.6t. In the final step we divide the equity value by the number of shares outstanding. Compared to the current share price of ₹809, the company appears slightly overvalued at the time of writing. Remember though, that this is just an approximate valuation, and like any complex formula - garbage in, garbage out.
The Assumptions
We would point out that the most important inputs to a discounted cash flow are the discount rate and of course the actual cash flows. Part of investing is coming up with your own evaluation of a company's future performance, so try the calculation yourself and check your own assumptions. The DCF also does not consider the possible cyclicality of an industry, or a company's future capital requirements, so it does not give a full picture of a company's potential performance. Given that we are looking at JSW Steel as potential shareholders, the cost of equity is used as the discount rate, rather than the cost of capital (or weighted average cost of capital, WACC) which accounts for debt. In this calculation we've used 17%, which is based on a levered beta of 1.334. Beta is a measure of a stock's volatility, compared to the market as a whole. We get our beta from the industry average beta of globally comparable companies, with an imposed limit between 0.8 and 2.0, which is a reasonable range for a stable business.
SWOT Analysis for JSW Steel
- Earnings growth over the past year exceeded the industry.
- Debt is well covered by earnings and cashflows.
- Dividends are covered by earnings and cash flows.
- Dividend is low compared to the top 25% of dividend payers in the Metals and Mining market.
- Annual earnings are forecast to grow faster than the Indian market.
- Good value based on P/E ratio compared to estimated Fair P/E ratio.
- Annual revenue is forecast to grow slower than the Indian market.
Moving On:
Although the valuation of a company is important, it is only one of many factors that you need to assess for a company. It's not possible to obtain a foolproof valuation with a DCF model. Preferably you'd apply different cases and assumptions and see how they would impact the company's valuation. For example, changes in the company's cost of equity or the risk free rate can significantly impact the valuation. Why is the intrinsic value lower than the current share price? For JSW Steel, there are three additional items you should look at:
- Risks: As an example, we've found 2 warning signs for JSW Steel that you need to consider before investing here.
- Future Earnings: How does JSWSTEEL's growth rate compare to its peers and the wider market? Dig deeper into the analyst consensus number for the upcoming years by interacting with our free analyst growth expectation chart.
- Other High Quality Alternatives: Do you like a good all-rounder? Explore our interactive list of high quality stocks to get an idea of what else is out there you may be missing!
PS. Simply Wall St updates its DCF calculation for every Indian stock every day, so if you want to find the intrinsic value of any other stock just search here.
New: Manage All Your Stock Portfolios in One Place
We've created the ultimate portfolio companion for stock investors, and it's free.
• Connect an unlimited number of Portfolios and see your total in one currency
• Be alerted to new Warning Signs or Risks via email or mobile
• Track the Fair Value of your stocks
Have feedback on this article? Concerned about the content? Get in touch with us directly. Alternatively, email editorial-team (at) simplywallst.com.
This article by Simply Wall St is general in nature. We provide commentary based on historical data and analyst forecasts only using an unbiased methodology and our articles are not intended to be financial advice. It does not constitute a recommendation to buy or sell any stock, and does not take account of your objectives, or your financial situation. We aim to bring you long-term focused analysis driven by fundamental data. Note that our analysis may not factor in the latest price-sensitive company announcements or qualitative material. Simply Wall St has no position in any stocks mentioned.
About NSEI:JSWSTEEL
JSW Steel
Engages in the manufacture and sale of iron and steel products in India and internationally.
Reasonable growth potential second-rate dividend payer.
Similar Companies
Market Insights

Community Narratives


