- India
- /
- Metals and Mining
- /
- NSEI:HINDZINC
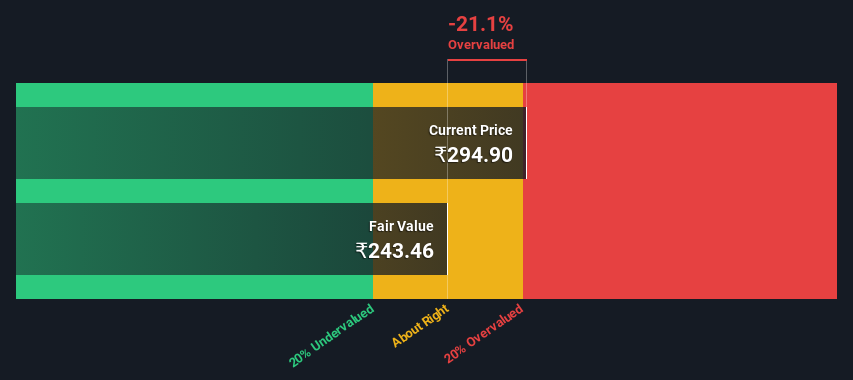
Is Hindustan Zinc Limited (NSE:HINDZINC) Worth ₹295 Based On Its Intrinsic Value?


Key Insights
- The projected fair value for Hindustan Zinc is ₹243 based on 2 Stage Free Cash Flow to Equity
- Current share price of ₹295 suggests Hindustan Zinc is potentially 21% overvalued
- The ₹277 analyst price target for HINDZINC is 14% more than our estimate of fair value
In this article we are going to estimate the intrinsic value of Hindustan Zinc Limited (NSE:HINDZINC) by taking the expected future cash flows and discounting them to their present value. This will be done using the Discounted Cash Flow (DCF) model. It may sound complicated, but actually it is quite simple!
We generally believe that a company's value is the present value of all of the cash it will generate in the future. However, a DCF is just one valuation metric among many, and it is not without flaws. If you want to learn more about discounted cash flow, the rationale behind this calculation can be read in detail in the Simply Wall St analysis model.
See our latest analysis for Hindustan Zinc
The Calculation
We use what is known as a 2-stage model, which simply means we have two different periods of growth rates for the company's cash flows. Generally the first stage is higher growth, and the second stage is a lower growth phase. In the first stage we need to estimate the cash flows to the business over the next ten years. Where possible we use analyst estimates, but when these aren't available we extrapolate the previous free cash flow (FCF) from the last estimate or reported value. We assume companies with shrinking free cash flow will slow their rate of shrinkage, and that companies with growing free cash flow will see their growth rate slow, over this period. We do this to reflect that growth tends to slow more in the early years than it does in later years.
Generally we assume that a dollar today is more valuable than a dollar in the future, and so the sum of these future cash flows is then discounted to today's value:
10-year free cash flow (FCF) forecast
| 2024 | 2025 | 2026 | 2027 | 2028 | 2029 | 2030 | 2031 | 2032 | 2033 | |
| Levered FCF (₹, Millions) | ₹77.2b | ₹99.6b | ₹107.6b | ₹115.2b | ₹123.1b | ₹131.6b | ₹140.6b | ₹150.1b | ₹160.2b | ₹171.0b |
| Growth Rate Estimate Source | Analyst x6 | Analyst x6 | Analyst x5 | Est @ 7.01% | Est @ 6.92% | Est @ 6.86% | Est @ 6.81% | Est @ 6.78% | Est @ 6.76% | Est @ 6.75% |
| Present Value (₹, Millions) Discounted @ 16% | ₹66.6k | ₹74.2k | ₹69.3k | ₹64.0k | ₹59.1k | ₹54.5k | ₹50.3k | ₹46.4k | ₹42.8k | ₹39.4k |
("Est" = FCF growth rate estimated by Simply Wall St)
Present Value of 10-year Cash Flow (PVCF) = ₹567b
The second stage is also known as Terminal Value, this is the business's cash flow after the first stage. For a number of reasons a very conservative growth rate is used that cannot exceed that of a country's GDP growth. In this case we have used the 5-year average of the 10-year government bond yield (6.7%) to estimate future growth. In the same way as with the 10-year 'growth' period, we discount future cash flows to today's value, using a cost of equity of 16%.
Terminal Value (TV)= FCF2033 × (1 + g) ÷ (r – g) = ₹171b× (1 + 6.7%) ÷ (16%– 6.7%) = ₹2.0t
Present Value of Terminal Value (PVTV)= TV / (1 + r)10= ₹2.0t÷ ( 1 + 16%)10= ₹462b
The total value, or equity value, is then the sum of the present value of the future cash flows, which in this case is ₹1.0t. In the final step we divide the equity value by the number of shares outstanding. Compared to the current share price of ₹295, the company appears slightly overvalued at the time of writing. Remember though, that this is just an approximate valuation, and like any complex formula - garbage in, garbage out.
Important Assumptions
We would point out that the most important inputs to a discounted cash flow are the discount rate and of course the actual cash flows. If you don't agree with these result, have a go at the calculation yourself and play with the assumptions. The DCF also does not consider the possible cyclicality of an industry, or a company's future capital requirements, so it does not give a full picture of a company's potential performance. Given that we are looking at Hindustan Zinc as potential shareholders, the cost of equity is used as the discount rate, rather than the cost of capital (or weighted average cost of capital, WACC) which accounts for debt. In this calculation we've used 16%, which is based on a levered beta of 1.166. Beta is a measure of a stock's volatility, compared to the market as a whole. We get our beta from the industry average beta of globally comparable companies, with an imposed limit between 0.8 and 2.0, which is a reasonable range for a stable business.
SWOT Analysis for Hindustan Zinc
- Debt is not viewed as a risk.
- Dividend is in the top 25% of dividend payers in the market.
- Earnings declined over the past year.
- Annual earnings are forecast to grow for the next 3 years.
- Good value based on P/E ratio compared to estimated Fair P/E ratio.
- Dividends are not covered by earnings and cashflows.
- Annual earnings are forecast to grow slower than the Indian market.
Next Steps:
Whilst important, the DCF calculation ideally won't be the sole piece of analysis you scrutinize for a company. DCF models are not the be-all and end-all of investment valuation. Preferably you'd apply different cases and assumptions and see how they would impact the company's valuation. For instance, if the terminal value growth rate is adjusted slightly, it can dramatically alter the overall result. Why is the intrinsic value lower than the current share price? For Hindustan Zinc, we've compiled three further factors you should further research:
- Risks: To that end, you should be aware of the 1 warning sign we've spotted with Hindustan Zinc .
- Future Earnings: How does HINDZINC's growth rate compare to its peers and the wider market? Dig deeper into the analyst consensus number for the upcoming years by interacting with our free analyst growth expectation chart.
- Other Solid Businesses: Low debt, high returns on equity and good past performance are fundamental to a strong business. Why not explore our interactive list of stocks with solid business fundamentals to see if there are other companies you may not have considered!
PS. The Simply Wall St app conducts a discounted cash flow valuation for every stock on the NSEI every day. If you want to find the calculation for other stocks just search here.
Valuation is complex, but we're here to simplify it.
Discover if Hindustan Zinc might be undervalued or overvalued with our detailed analysis, featuring fair value estimates, potential risks, dividends, insider trades, and its financial condition.
Access Free AnalysisHave feedback on this article? Concerned about the content? Get in touch with us directly. Alternatively, email editorial-team (at) simplywallst.com.
This article by Simply Wall St is general in nature. We provide commentary based on historical data and analyst forecasts only using an unbiased methodology and our articles are not intended to be financial advice. It does not constitute a recommendation to buy or sell any stock, and does not take account of your objectives, or your financial situation. We aim to bring you long-term focused analysis driven by fundamental data. Note that our analysis may not factor in the latest price-sensitive company announcements or qualitative material. Simply Wall St has no position in any stocks mentioned.
About NSEI:HINDZINC
Hindustan Zinc
Explores for, extracts, and processes minerals in India, rest of Asia, and internationally.
Proven track record and fair value.
Similar Companies
Market Insights

Community Narratives
