Heranba Industries Limited (NSE:HERANBA) Stock Is Going Strong But Fundamentals Look Uncertain: What Lies Ahead ?


Heranba Industries (NSE:HERANBA) has had a great run on the share market with its stock up by a significant 15% over the last month. However, we decided to pay attention to the company's fundamentals which don't appear to give a clear sign about the company's financial health. Specifically, we decided to study Heranba Industries' ROE in this article.
Return on Equity or ROE is a test of how effectively a company is growing its value and managing investors’ money. In other words, it is a profitability ratio which measures the rate of return on the capital provided by the company's shareholders.
View our latest analysis for Heranba Industries
How Do You Calculate Return On Equity?
The formula for return on equity is:
Return on Equity = Net Profit (from continuing operations) ÷ Shareholders' Equity
So, based on the above formula, the ROE for Heranba Industries is:
5.5% = ₹451m ÷ ₹8.3b (Based on the trailing twelve months to September 2023).
The 'return' is the amount earned after tax over the last twelve months. Another way to think of that is that for every ₹1 worth of equity, the company was able to earn ₹0.05 in profit.
What Has ROE Got To Do With Earnings Growth?
Thus far, we have learned that ROE measures how efficiently a company is generating its profits. Based on how much of its profits the company chooses to reinvest or "retain", we are then able to evaluate a company's future ability to generate profits. Assuming everything else remains unchanged, the higher the ROE and profit retention, the higher the growth rate of a company compared to companies that don't necessarily bear these characteristics.
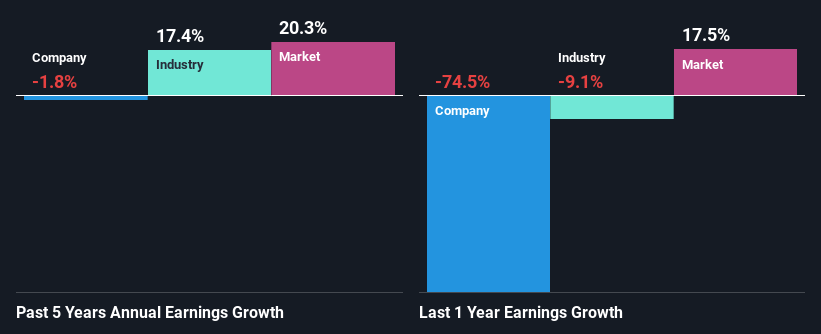
A Side By Side comparison of Heranba Industries' Earnings Growth And 5.5% ROE
As you can see, Heranba Industries' ROE looks pretty weak. Not just that, even compared to the industry average of 11%, the company's ROE is entirely unremarkable. Hence, the flat earnings seen by Heranba Industries over the past five years could probably be the result of it having a lower ROE.
We then compared Heranba Industries' net income growth with the industry and found that the average industry growth rate was 17% in the same 5-year period.
Earnings growth is an important metric to consider when valuing a stock. The investor should try to establish if the expected growth or decline in earnings, whichever the case may be, is priced in. By doing so, they will have an idea if the stock is headed into clear blue waters or if swampy waters await. Is Heranba Industries fairly valued compared to other companies? These 3 valuation measures might help you decide.
Is Heranba Industries Using Its Retained Earnings Effectively?
Heranba Industries has a low three-year median payout ratio of 4.5% (or a retention ratio of 95%) but the negligible earnings growth number doesn't reflect this as high growth usually follows high profit retention.
Only recently, Heranba Industries started paying a dividend. This means that the management might have concluded that its shareholders prefer dividends over earnings growth.
Summary
On the whole, we feel that the performance shown by Heranba Industries can be open to many interpretations. While the company does have a high rate of reinvestment, the low ROE means that all that reinvestment is not reaping any benefit to its investors, and moreover, its having a negative impact on the earnings growth. Up till now, we've only made a short study of the company's growth data. To gain further insights into Heranba Industries' past profit growth, check out this visualization of past earnings, revenue and cash flows.
Valuation is complex, but we're here to simplify it.
Discover if Heranba Industries might be undervalued or overvalued with our detailed analysis, featuring fair value estimates, potential risks, dividends, insider trades, and its financial condition.
Access Free AnalysisHave feedback on this article? Concerned about the content? Get in touch with us directly. Alternatively, email editorial-team (at) simplywallst.com.
This article by Simply Wall St is general in nature. We provide commentary based on historical data and analyst forecasts only using an unbiased methodology and our articles are not intended to be financial advice. It does not constitute a recommendation to buy or sell any stock, and does not take account of your objectives, or your financial situation. We aim to bring you long-term focused analysis driven by fundamental data. Note that our analysis may not factor in the latest price-sensitive company announcements or qualitative material. Simply Wall St has no position in any stocks mentioned.
About NSEI:HERANBA
Heranba Industries
Engages in the manufacture and sale of various agrochemicals in India.
Excellent balance sheet unattractive dividend payer.
Similar Companies
Market Insights

Community Narratives

