
Advertisement
We're Watching These Trends At Dynemic Products (NSE:DYNPRO)
If we want to find a stock that could multiply over the long term, what are the underlying trends we should look for? Firstly, we'd want to identify a growing return on capital employed (ROCE) and then alongside that, an ever-increasing base of capital employed. Put simply, these types of businesses are compounding machines, meaning they are continually reinvesting their earnings at ever-higher rates of return. Having said that, from a first glance at Dynemic Products (NSE:DYNPRO) we aren't jumping out of our chairs at how returns are trending, but let's have a deeper look.
Understanding Return On Capital Employed (ROCE)
Just to clarify if you're unsure, ROCE is a metric for evaluating how much pre-tax income (in percentage terms) a company earns on the capital invested in its business. Analysts use this formula to calculate it for Dynemic Products:
Return on Capital Employed = Earnings Before Interest and Tax (EBIT) ÷ (Total Assets - Current Liabilities)
0.16 = ₹352m ÷ (₹2.7b - ₹462m) (Based on the trailing twelve months to September 2020).
Thus, Dynemic Products has an ROCE of 16%. That's a relatively normal return on capital, and it's around the 14% generated by the Chemicals industry.
View our latest analysis for Dynemic Products
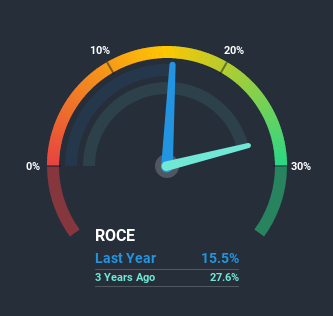
Historical performance is a great place to start when researching a stock so above you can see the gauge for Dynemic Products' ROCE against it's prior returns. If you're interested in investigating Dynemic Products' past further, check out this free graph of past earnings, revenue and cash flow.
So How Is Dynemic Products' ROCE Trending?
On the surface, the trend of ROCE at Dynemic Products doesn't inspire confidence. To be more specific, ROCE has fallen from 21% over the last five years. However it looks like Dynemic Products might be reinvesting for long term growth because while capital employed has increased, the company's sales haven't changed much in the last 12 months. It may take some time before the company starts to see any change in earnings from these investments.
On a side note, Dynemic Products has done well to pay down its current liabilities to 17% of total assets. So we could link some of this to the decrease in ROCE. Effectively this means their suppliers or short-term creditors are funding less of the business, which reduces some elements of risk. Some would claim this reduces the business' efficiency at generating ROCE since it is now funding more of the operations with its own money.What We Can Learn From Dynemic Products' ROCE
To conclude, we've found that Dynemic Products is reinvesting in the business, but returns have been falling. Although the market must be expecting these trends to improve because the stock has gained 37% over the last three years. However, unless these underlying trends turn more positive, we wouldn't get our hopes up too high.
Since virtually every company faces some risks, it's worth knowing what they are, and we've spotted 4 warning signs for Dynemic Products (of which 2 are a bit unpleasant!) that you should know about.
For those who like to invest in solid companies, check out this free list of companies with solid balance sheets and high returns on equity.
If you’re looking to trade Dynemic Products, open an account with the lowest-cost* platform trusted by professionals, Interactive Brokers. Their clients from over 200 countries and territories trade stocks, options, futures, forex, bonds and funds worldwide from a single integrated account. Promoted
New: Manage All Your Stock Portfolios in One Place
We've created the ultimate portfolio companion for stock investors, and it's free.
• Connect an unlimited number of Portfolios and see your total in one currency
• Be alerted to new Warning Signs or Risks via email or mobile
• Track the Fair Value of your stocks
This article by Simply Wall St is general in nature. It does not constitute a recommendation to buy or sell any stock, and does not take account of your objectives, or your financial situation. We aim to bring you long-term focused analysis driven by fundamental data. Note that our analysis may not factor in the latest price-sensitive company announcements or qualitative material. Simply Wall St has no position in any stocks mentioned.
*Interactive Brokers Rated Lowest Cost Broker by StockBrokers.com Annual Online Review 2020
Have feedback on this article? Concerned about the content? Get in touch with us directly. Alternatively, email editorial-team (at) simplywallst.com.
About NSEI:DYNPRO
Dynemic Products
Engages in the manufacture and sale of dyes and dye intermediates in India.
Proven track record with adequate balance sheet.
Market Insights

Advertisement
Community Narratives
A formidable player in AI and enterprise computing.
Fair Value US$210.00|12.2% overvalued
CO
Community Contributor
IREN's Bold Moves in Sustainable Bitcoin Mining & AI Data Centers
Fair Value US$72.52|17.1% undervalued
BL
Community Contributor
Cooling the Champions: The Aussie Tech Behind F1's Victories
Fair Value AU$12.40|38.7% undervalued
TR
Community Contributor