Chambal Fertilisers and Chemicals' (NSE:CHAMBLFERT) earnings growth rate lags the 33% CAGR delivered to shareholders

It might seem bad, but the worst that can happen when you buy a stock (without leverage) is that its share price goes to zero. But when you pick a company that is really flourishing, you can make more than 100%. For example, the Chambal Fertilisers and Chemicals Limited (NSE:CHAMBLFERT) share price has soared 120% in the last three years. Most would be happy with that. But it's down 4.0% in the last week.
While this past week has detracted from the company's three-year return, let's look at the recent trends of the underlying business and see if the gains have been in alignment.
See our latest analysis for Chambal Fertilisers and Chemicals
There is no denying that markets are sometimes efficient, but prices do not always reflect underlying business performance. One flawed but reasonable way to assess how sentiment around a company has changed is to compare the earnings per share (EPS) with the share price.
Chambal Fertilisers and Chemicals was able to grow its EPS at 1.6% per year over three years, sending the share price higher. This EPS growth is lower than the 30% average annual increase in the share price. This suggests that, as the business progressed over the last few years, it gained the confidence of market participants. That's not necessarily surprising considering the three-year track record of earnings growth.
The image below shows how EPS has tracked over time (if you click on the image you can see greater detail).
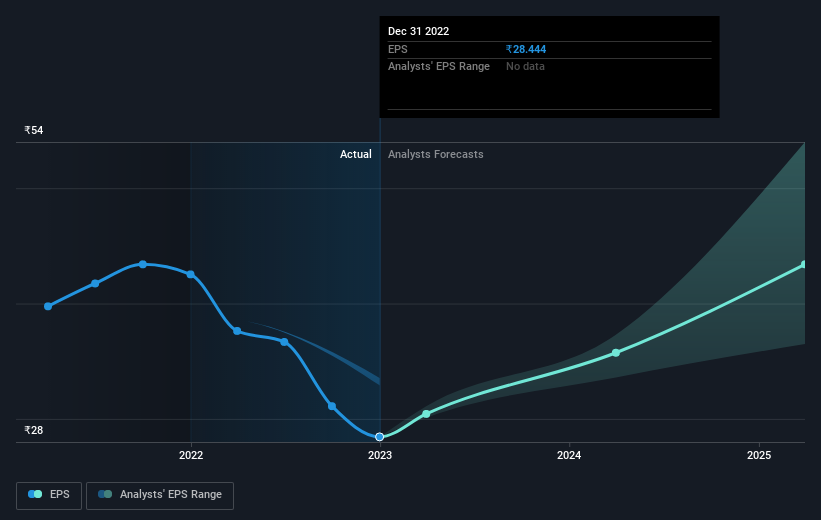
Dive deeper into Chambal Fertilisers and Chemicals' key metrics by checking this interactive graph of Chambal Fertilisers and Chemicals's earnings, revenue and cash flow.
What About Dividends?
When looking at investment returns, it is important to consider the difference between total shareholder return (TSR) and share price return. The TSR is a return calculation that accounts for the value of cash dividends (assuming that any dividend received was reinvested) and the calculated value of any discounted capital raisings and spin-offs. So for companies that pay a generous dividend, the TSR is often a lot higher than the share price return. We note that for Chambal Fertilisers and Chemicals the TSR over the last 3 years was 135%, which is better than the share price return mentioned above. And there's no prize for guessing that the dividend payments largely explain the divergence!
A Different Perspective
Chambal Fertilisers and Chemicals shareholders are down 17% for the year (even including dividends), but the market itself is up 12%. Even the share prices of good stocks drop sometimes, but we want to see improvements in the fundamental metrics of a business, before getting too interested. Longer term investors wouldn't be so upset, since they would have made 14%, each year, over five years. If the fundamental data continues to indicate long term sustainable growth, the current sell-off could be an opportunity worth considering. It's always interesting to track share price performance over the longer term. But to understand Chambal Fertilisers and Chemicals better, we need to consider many other factors. Like risks, for instance. Every company has them, and we've spotted 3 warning signs for Chambal Fertilisers and Chemicals (of which 1 is a bit concerning!) you should know about.
Of course, you might find a fantastic investment by looking elsewhere. So take a peek at this free list of companies we expect will grow earnings.
Please note, the market returns quoted in this article reflect the market weighted average returns of stocks that currently trade on Indian exchanges.
New: AI Stock Screener & Alerts
Our new AI Stock Screener scans the market every day to uncover opportunities.
• Dividend Powerhouses (3%+ Yield)
• Undervalued Small Caps with Insider Buying
• High growth Tech and AI Companies
Or build your own from over 50 metrics.
Have feedback on this article? Concerned about the content? Get in touch with us directly. Alternatively, email editorial-team (at) simplywallst.com.
This article by Simply Wall St is general in nature. We provide commentary based on historical data and analyst forecasts only using an unbiased methodology and our articles are not intended to be financial advice. It does not constitute a recommendation to buy or sell any stock, and does not take account of your objectives, or your financial situation. We aim to bring you long-term focused analysis driven by fundamental data. Note that our analysis may not factor in the latest price-sensitive company announcements or qualitative material. Simply Wall St has no position in any stocks mentioned.
About NSEI:CHAMBLFERT
Chambal Fertilisers and Chemicals
Produces and sells fertilizers primarily in India.
Flawless balance sheet with solid track record and pays a dividend.

